
Largest Contentful Paint (LCP) is the time from the moment a page starts loading until the largest visible element in the viewport has finished rendering, and 2.5 seconds or less at the 75th percentile is the mark of a good result. Anything above 2.5 seconds up to 4.0 seconds needs improvement, and anything past 4.0 seconds is poor.
So which element is the metric timing? That question is where many teams lose a sprint.
Ask what is Largest Contentful Paint and most guides point at the hero image and stop. The metric points at whichever eligible element is largest at the final paint, and that candidate can change halfway through the load: a headline holds the crown early, a photo takes it a second later. On a phone it may be a different element than on a 27-inch monitor. Optimizing the wrong one is the most common way to make a page faster and watch the number sit still.
Table of Contents
- What Largest Contentful Paint Measures in Plain English
- Reading the Good, Needs Improvement and Poor LCP Thresholds
- How Browsers Time the Paint From Start to Finish
- The Hidden Twist Where the LCP Element Changes
- Reading LCP in Lighthouse and the Chrome UX Report
- Common Causes of Poor LCP and How to Fix Them
- Confirm Your Field LCP Before Your Next Speed Fix
What Largest Contentful Paint Measures in Plain English
Picture a wizard hunched over a crystal ball, waiting for the fog to clear so the most important figure of the day appears. That is roughly what the metric does for a webpage.

Largest Contentful Paint measures the time from when a page begins loading until the largest image, text block, or video visible in the viewport is rendered. The MDN LargestContentfulPaint reference lists what can win that contest:
- Images painted through an
<img>tag or an SVG<image>element - Video poster frames, timed from the poster image or the first rendered frame
- CSS background images, when the element carrying them is large enough
- Blocks of text, including headings, paragraphs, and groups of text nodes
Notice what's missing from that list. Icons, logos, buttons, decorative sprites. The metric behaves like a stage spotlight: it follows the star of the show, not the usher who walked in first. A visitor who sees a spinning logo but no headline has seen nothing worth waiting for.
Why the biggest thing on screen matters more than the first thing
Visitors judge a page by whether its main content has appeared, not by whether some pixel flickered into existence. A page can paint a navigation bar in 0.4 seconds and still feel broken, because the part they came for is a blank rectangle.
The one-line version: LCP is the moment a page's main spell becomes visible to the visitor.
It also carries weight beyond user experience. LCP is one of the three Core Web Vitals, the set Google folds into its page-experience guidance, so the reading lands in both engineering reviews and search-performance monitoring. A slow LCP is not a cosmetic flaw. It's a signal that the page took too long to show its reason for existing.
Reading the Good, Needs Improvement and Poor LCP Thresholds
Three verdicts cover every score. Learn the table and you can classify any page in ten seconds.
| Rating | LCP at 75th percentile | What visitors experience |
|---|---|---|
| Good | 2.5 seconds or less | The main content feels instant |
| Needs improvement | Above 2.5 seconds up to 4.0 seconds | Visitors notice a pause before the content appears |
| Poor | Above 4.0 seconds | Visitors wonder whether the page is broken |
Those cutoffs come straight from Google's guidance: an LCP of 2.5 seconds or less is good, above 2.5 and up to 4 seconds needs improvement, and above 4 seconds is poor, per web.dev's LCP article. Google measures at the 75th percentile of visits rather than the average, and it assesses mobile and desktop separately because the same page performs differently on each.
Why a percentile beats an average
An average hides the visitors who had the worst time. Say a site's 75th-percentile LCP is 3.8 seconds. That means at least 75% of measured visits reached the largest content by 3.8 seconds, while the slowest quarter took longer, as Google's Web Vitals guidance explains. The average might read 2.4 seconds and look healthy while a quarter of your visitors stare at a half-drawn page.
Position matters too. A hero that paints in 2.1 seconds for most visits only earns a good rating if at least 75% of visits reach it by 2.5 seconds. Quote the percentile, not the typical run, or you'll mislabel your own site.
Rating a page isn't only a performance exercise. Because these verdicts feed Google's page-experience signals, how Core Web Vitals affect SEO is worth reading once you have your labels, since it shows how loading, interactivity and visual stability get scored together.
Wondering why 2.5 seconds rather than a stricter target? Google's threshold analysis found 2.5 seconds was consistently achievable across real-world load distributions while 1.5- and 2-second targets were not, which is documented in how Core Web Vitals thresholds were defined. The bar is set where a well-built page can reach it.
Before you change anything, record two numbers: the 75th-percentile field LCP for mobile and the same for desktop. Label each one good, needs improvement, or poor. That label is your baseline, and everything else in this guide hangs off it.
How Browsers Time the Paint From Start to Finish
The clock doesn't start when your hero image starts downloading. It starts at navigation start, the instant the browser begins the page load, and from there it keeps a running scorecard. The W3C Largest Contentful Paint specification describes how the browser continuously evaluates eligible candidates as resources arrive, because the visually largest element can change several times before one holds the title.
Here's the journey in one picture.
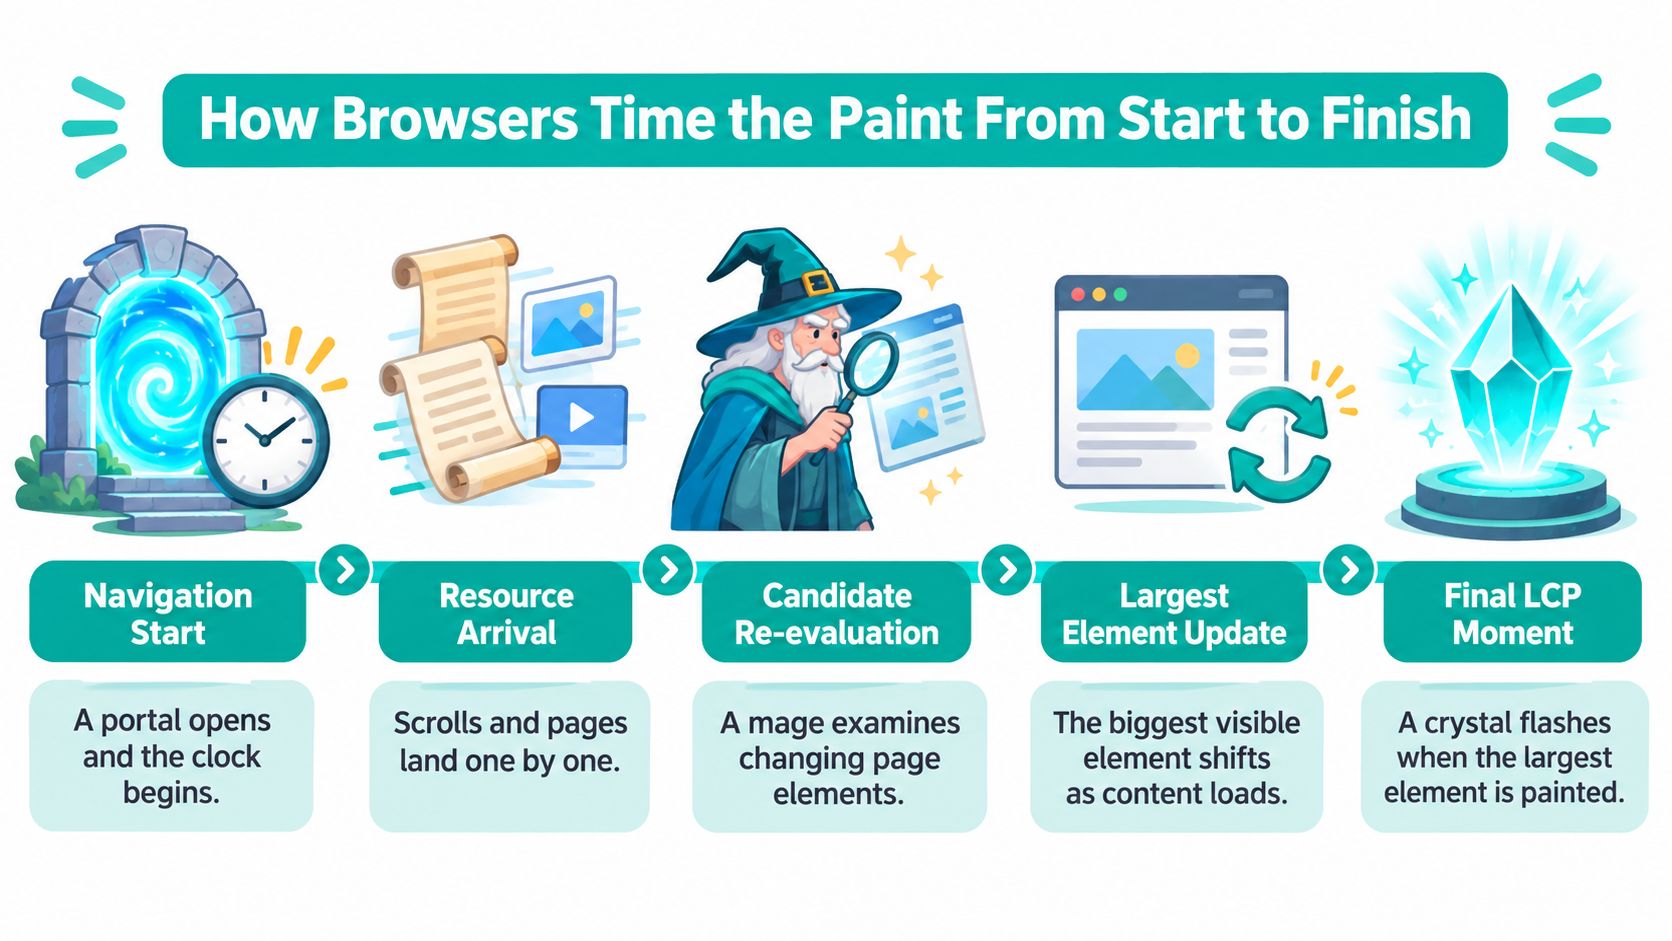
What the reading contains is broader than server speed. It swallows redirects, connection setup, time to first byte, resource download, and render delay. For video, the timer uses the poster image or the first rendered frame, whichever lands first.
Four stops on the LCP journey
- Server delay: the wait for the first byte after the request goes out.
- Resource load delay: the gap between the HTML arriving and the browser discovering the winning element.
- Resource duration: the download of that element, measured in bytes over bandwidth.
- Render delay: the main thread finishing whatever blocks it from painting the element.
A worked example makes the arithmetic plain. Suppose the server responds in 1.2 seconds, the hero image takes 2 seconds to download, and rendering waits another 0.3 seconds behind a script. That lands near 3.5 seconds, which is a poor-to-needs-improvement result even though nobody did anything dramatic. Nothing here says "code is broken." Four small waits stacked up.
Lab runs and field data answer different questions
A Lighthouse run simulates one controlled load on a defined connection and device. Field data comes from real visitors on real phones, patchy networks and cached repeat visits. The spec's authors recommend collecting real-user measurements precisely because lab tests may not reproduce mobile network, device, cache, or interaction conditions.
Once you know which phase is eating the seconds, the workflow for how to optimize website speed becomes a checklist rather than a guessing game. The order is fixed: identify the actual LCP element, then trim its server response, clear the render-blocking work in front of it, size the asset correctly, and make sure it appears early in the HTML.
Do this first: open the tool report and read the name of the LCP element. Everything after that is a decision about one asset.
The Hidden Twist Where the LCP Element Changes
Here's the belief worth dismantling: LCP is the time until the biggest image finishes downloading. That sounds right and it's wrong often enough to waste real money.
The metric records when an element is rendered, not when its file finishes arriving. Depending on browser conditions, the reported value can reflect the element's render time or its load time, as the 2026 W3C LCP working draft notes. A page can finish downloading its hero in 1.4 seconds and still log a 3.2-second LCP because nothing painted until a stylesheet resolved.
A headline wins the crown, then loses it
Walk through a typical load. The HTML arrives and a large <h1> renders at 1.1 seconds. It's the biggest thing in the viewport, so it becomes the candidate. At 2.6 seconds the hero photograph paints and dwarfs the headline, so the browser promotes the photo. The final LCP is the photo's paint time, not the headline's.
This is why "optimize the biggest image" advice sometimes misses. If your hero photo is decorative and sits in a CSS background that never becomes the candidate, compressing it changes nothing.
Why desktop and mobile disagree
Viewport width decides the contest. A 1600-pixel-wide desktop viewport can crown a wide hero image, while a 390-pixel-wide phone shows a cropped, shorter version of it and crowns a text block instead. Same page, two measured elements, two different scores. That's also why a visually dominant image may lose: if it sits below the fold, or if a larger text block paints before it, the image is never the measured element.
Keep an eye on these three traps:
- A late-discovered hero that's referenced only in CSS or JavaScript, so the browser learns about it after it has already started painting.
- CSS that blocks text, holding back a headline that would otherwise have been the candidate.
- Client-side code that delays the final element, letting a framework decide when the largest block appears.
AI-generated landing pages make this twist sharper. Automatically chosen imagery, fonts, animations and responsive layouts can shift the candidate from a headline to an image between one device and the next, so a page that hits good on a laptop may not on a phone.
Fix the named element, not the one you assumed. Check the diagnostic's element name in both a lab run and field data, then start there.
Reading LCP in Lighthouse and the Chrome UX Report
Two numbers describe your LCP, and they rarely agree. One comes from a simulated load in a lab, the other from visitors who showed up. Knowing which one you're staring at prevents a lot of pointless arguing.
| Tool or report | Data type | Best use | Limitation |
|---|---|---|---|
| Lighthouse | Lab, one simulated load | Finding the LCP element and its phases | One controlled run may not match real visitors |
| PageSpeed Insights | Field and lab together | Comparing the 75th percentile with a lab run | Field section can be empty for low-traffic pages |
| Chrome UX Report | Field, real Chrome users | Percentile distributions by device and origin | Reported at 100-millisecond granularity, not per visit |
| Search Console Core Web Vitals report | Field, grouped by URL pattern | Spotting groups of pages that need work | Groups URLs, so check individual pages separately |
The Chrome UX Report deserves a note on precision. Its CrUX dashboard publishes LCP as percentile distributions and histograms with 100-millisecond granularity, so a reported 1,500 milliseconds is precise to roughly a tenth of a second, not to the millisecond. Treat small movements as noise. The 2.5-second and 4-second boundaries remain the lines that matter, and they trace back to the Web Vitals initiative Google launched in May 2020 to complement older measures like page-load time and First Contentful Paint.
Finding the element in Chrome DevTools
Open the page, open DevTools, switch to the Performance panel, and record a fresh load. Look for the LCP marker on the timeline, then read the summary: it names the element that qualified and how much render delay sat in front of it. That name is the answer to "what should I fix."
Three habits keep the reading honest:
- Read field data before lab data, because field data reflects the visitors you have.
- Split mobile from desktop every single time you quote a score.
- Compare before and after using the same device class, or you'll credit a change for a difference the hardware made.
If you want to test website speed across Australia where latency to your host varies wildly by city, run the test from a location near your audience rather than from a default node. And when you're choosing which of these panels to keep open weekly, this guide to website performance optimization tools narrows the field.
Common Causes of Poor LCP and How to Fix Them
Start from the symptom. The number tells you something is slow; the symptom tells you which spell to cast.
| Symptom | Likely cause | Fix |
|---|---|---|
| Slow first response | Slow server, hosting or no caching | Faster hosting, caching or a CDN |
| Hero image appears late | Image only referenced in CSS or JavaScript | Put the image in the HTML and preload it only if discovery is late |
| Hero image is slow to load | Oversized file for the viewport | Responsive image sizes and modern compression |
| Hero image appears late, lazy-loaded | Above-the-fold image is lazy-loaded | Remove lazy loading from the LCP image |
| Page waits before painting | Render-blocking CSS or JavaScript | Defer nonessential scripts and inline critical CSS |
| Hero image competes with other downloads | Other resources take bandwidth first | Set fetchpriority high on the confirmed LCP image only |
| Headline appears late | Text rendered by client-side scripts | Render key text in server HTML |
A slow first response usually traces to the server itself: shared hosting without caching, or a page that has to assemble itself on every request. When the hero image is discovered late, the culprit is almost always a CSS background or a JavaScript-inserted tag, so fixing Shopify LCP problems in production themes follows the same logic and there's a broader walkthrough in this guide to how to improve Core Web Vitals.
Oversized files are the easiest win and the most frequently skipped. Serving a 2,400-pixel image into a 390-pixel viewport wastes bandwidth on every visit. The guidance in Chrome's modern web performance guide is blunt: reserve layout space, serve responsive dimensions with modern compression, and treat LCP as a sequence of causal phases rather than one number.
Three rules that keep a fix from backfiring
- Raise priority on one asset only. Apply
fetchpriority="high"to the confirmed LCP image, never indiscriminately, because elevating non-LCP resources just increases contention. - Preload only when discovery is late. Preloading an image the HTML parser would have found immediately adds a competing request.
- Reserve the space before the image lands. Width and height attributes stop the layout shift that makes a fast paint feel chaotic.
The lazy-loading mistake is still everywhere. In 2024, 16% of mobile websites lazy-loaded their LCP images, down from 18% in 2022, according to the HTTP Archive Web Almanac. Nearly one in six mobile sites deliberately delays the one image the metric is timing.
Confirm Your Field LCP Before Your Next Speed Fix
A quick hero paint can still hide a slow interaction or a layout shift. Use field LCP as one clue, then check whether the element being timed is the one you need to fix.
- Label the baseline. Check the 75th-percentile field LCP separately for mobile and desktop. Mark each result as good, needs improvement, or poor.
- Name the element. Find the LCP element in your diagnostics and note the delay before it renders.
- Fix the cause for that element. Check server response, when the browser discovers it, its size, and any work blocking its render.
- Measure again after the field window updates. Field data uses a rolling window, so a change made today may not appear in the results tomorrow.
LCP is one gate, not the whole castle. A page can paint its main content quickly and still feel slow if taps are delayed or content jumps around. Check Interaction to Next Paint and Cumulative Layout Shift alongside LCP, and review how visitors move through the funnel.
Before making a speed change, confirm the LCP candidate for the relevant viewport. It can change during loading, and mobile and desktop may have different candidates. The crystal ball is only useful once you know which element it is showing you.
If that element is an image, Web Mage's Speed Sprite familiar compresses images and monitors page speed. Measure, find the element casting the spell, fix its bottleneck, then check the crystal ball again.
When you'd rather not build a page by hand, Web Mage generates complete pages and funnels from plain-language prompts. A full page costs about 60 credits, and you make further edits by typing a request in chat rather than adjusting a visual canvas.