
There's a particular Monday morning where you open Search Console, click into Core Web Vitals, and find half your URLs parked in a mustard-colored block labeled "needs improvement." The homepage looks fine on your laptop. Checkout feels snappy on office wifi. So you run Lighthouse, get a green 96, and close the tab like a wizard who has everything under control.
Then a customer on a three-year-old Android phone, standing on a train platform, taps add to cart and waits. That gap between what your machine measures and what real visitors feel is where every meaningful speed fix lives. Only 48% of mobile websites achieved good overall Core Web Vitals in 2025, up from 44% in 2024, according to HTTP Archive's 2025 Web Almanac performance report.
The fixes below are the ones I'd cast first, each with the failure it repairs, the number that proves it worked, and the trap that catches teams who optimize the lab instead of the field.
Table of Contents
- Core Web Vitals Targets to Hit First
- Measure Real Visitors Before You Touch Code
- Fix LCP by Getting the Hero Image Discovered Early
- Lazy-Load Only the Parts Below the Fold
- Stop Layout Shifts Before They Start
- Speed Up Slow Interactions Without Breaking Checkout
- Prioritize Your Fixes and Confirm the Gains
Core Web Vitals Targets to Hit First
Three metrics, three completely different failure modes, and they don't substitute for each other. Largest Contentful Paint (LCP) times how long the biggest thing on screen takes to appear, which is usually a hero image or a large headline block. Interaction to Next Paint (INP) measures the delay between a tap, click or key press and the next frame the visitor sees, sampled across the entire visit rather than just the first click. Cumulative Layout Shift (CLS) scores how much visible content lurches around while the page settles.
Google's definition of a passing page is unforgiving: LCP at 2.5 seconds or less, INP below 200 milliseconds, CLS at 0.1 or less, all judged at the 75th percentile of real visits, as the Search Console Core Web Vitals guidance sets out. Search Console displays those group values as the 75th percentile over the previous 28 days.
| Metric | Good | Needs Improvement | Poor |
|---|---|---|---|
| LCP (loading speed) | 2.5 seconds or less | Over 2.5 to 4.0 seconds | Over 4.0 seconds |
| INP (responsiveness) | 200 milliseconds or less | 200 to 500 milliseconds | Over 500 milliseconds |
| CLS (visual stability) | 0.1 or less | Over 0.1 to 0.25 | Over 0.25 |
The Quarter of Visitors Who Decide Your Grade
Read that percentile rule twice, because it's where most speed projects go sideways. A page passes only when three out of four visits clear the target. An average of 1.9 seconds means nothing if a quarter of your visitors are stuck at six. You aren't optimizing for the typical visit. You're optimizing for the worst quarter, which is exactly where abandoned carts and rage taps come from.
One piece of housekeeping: INP replaced First Input Delay as an official Core Web Vital on March 12, 2024, which is why older guides still chase a 100-millisecond FID target, as Google's introduction to INP explains. Refitting a page to FID is casting a spell that was retired.
If you want the reasoning behind each band rather than just the numbers, LCP, INP and CLS thresholds explained by Presidio covers how Google derived them.
Before you touch code, write down the current band for all three metrics on your single worst template. Every fix from here forward aims at moving one of those bands.
Measure Real Visitors Before You Touch Code
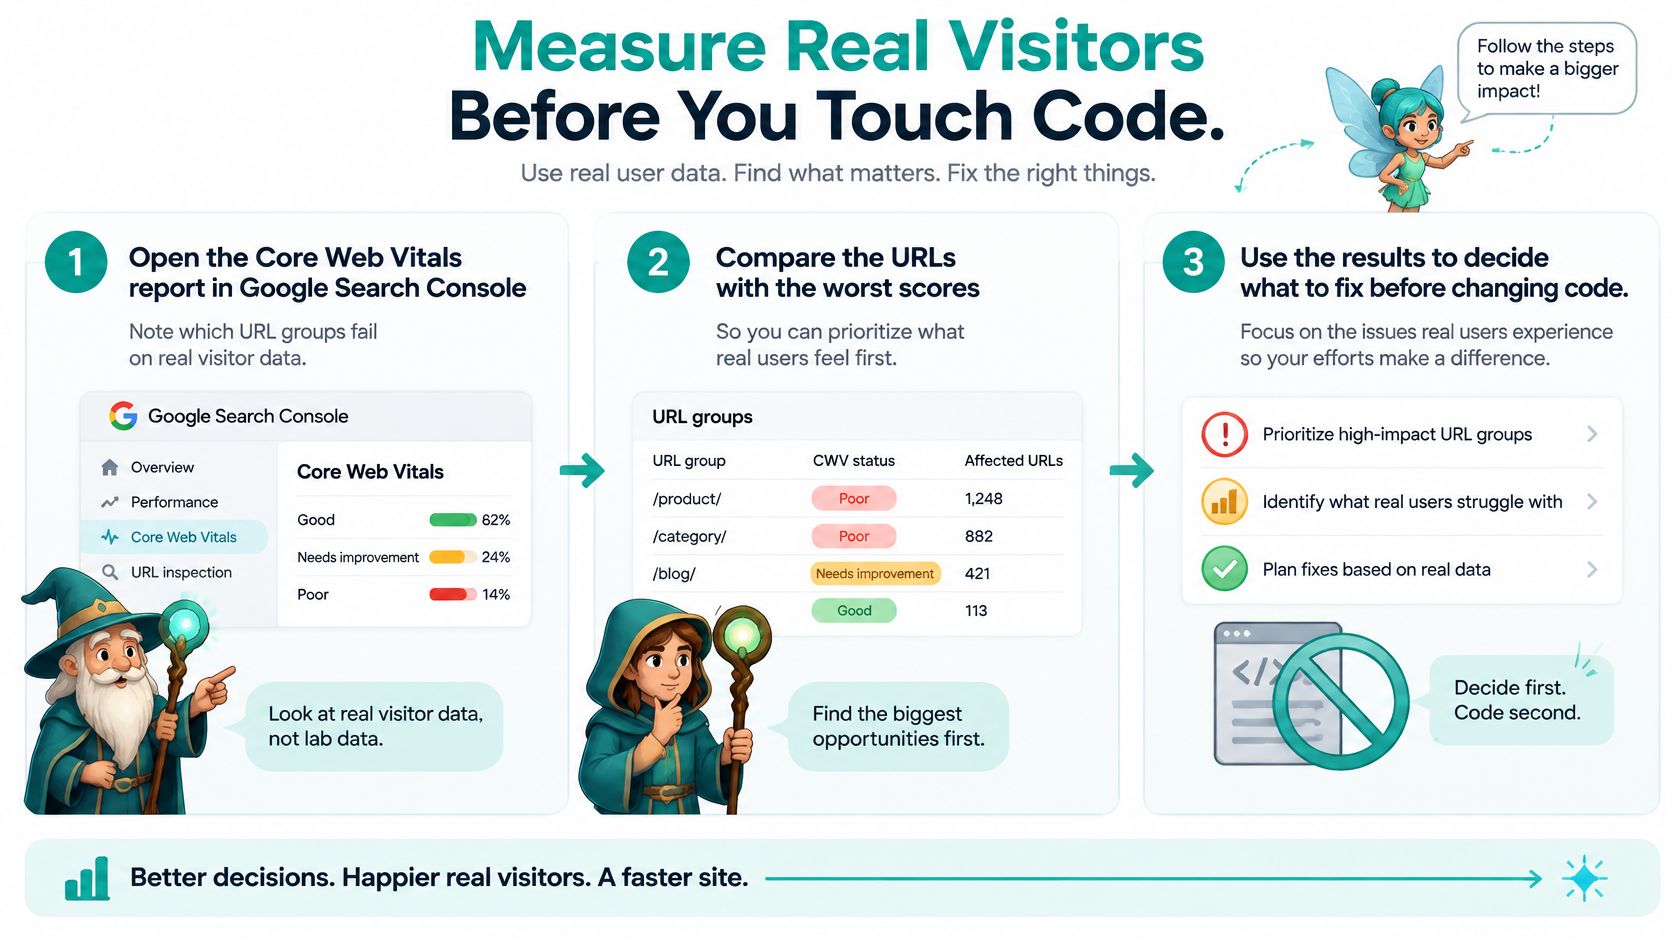
Diagnosis first, and diagnosis means field data. Google grades the 75th percentile of real Chrome visits, so that's what you read, per device class, using the field-first workflow web.dev's Core Web Vitals guide lays out. Here's the order I'd run it in.
- Open the Core Web Vitals report in Search Console and note which URL groups fail on mobile and which on desktop, separately. Google grades the two device classes independently, and mobile failures nearly always outnumber desktop ones.
- Run each failing URL through PageSpeed Insights and read the field section before the lab section. Those numbers come from real Chrome users over the last 28 days, which is the dataset your grade comes from.
- Pick the worst template, not the worst URL. A single product or checkout template can drive hundreds of URLs, so a template fix moves far more visits than a one-page patch.
- Record a DevTools performance trace of that template on a throttled connection to identify the LCP element and any long tasks blocking input. You can't fix what you haven't named.
- Change one thing, ship it, and leave it alone long enough for the reporting window to fill. Five stacked fixes leave you unable to say which one worked.
- Recheck the percentile against your baseline, per device, and keep the change only if the slow quarter improved.
Why a Green Lighthouse Score Can Still Fail
Lighthouse runs on a fixed emulated device and a scripted load. Field percentiles capture the mid-range phones, congested networks and post-load interactions that lab runs never see. A page can score 98 in the lab and fail on mobile in the field, and the field is what counts.
A perfect lab score is a rehearsal. The 75th percentile is opening night, with the audience holding three-year-old phones.
One more trap: optimizing the median instead of the 75th percentile. That feels good in a dashboard and leaves a substantial minority of visitors with a poor experience. If you'd rather not build the instrumentation yourself, this rundown of website performance optimization tools covers what to look for in a monitor that reports percentiles rather than averages.
Record baseline numbers in one place, per template, per device. Without a starting figure, every later comparison is a guess dressed up as progress.
Fix LCP by Getting the Hero Image Discovered Early
The LCP element is almost always a hero image or a large headline block, and you should confirm which with a trace before touching anything. Then measure how long the browser takes just to discover it, because that's the part often overlooked.

Google's performance guidance on lazy loading images and iframes reports that among pages with poor LCP, the LCP image carries a client-side loading delay of 1,290 milliseconds at the 75th percentile, more than half the entire 2.5-second budget. That's not download time. That's the browser being told, or forced, to wait before it even asks for the file.
The scale of the problem is visible across the web: only 59% of phone websites had good LCP in 2024, while 14% performed poorly, according to HTTP Archive's 2024 Web Almanac.
Summon the Hero Image First
Work from the biggest lever down.
- Render it in the initial HTML. Above-the-fold content served through client-side JavaScript adds a full round trip of script execution before the browser knows the image exists.
- Strip
loading="lazy"from the LCP image and addfetchpriority="high"so it competes for bandwidth ahead of everything else. - Preload it when the image is referenced only from CSS. A
<link rel="preload" as="image" fetchpriority="high">in the head makes the request start with the document, not after styles resolve. - Serve the right number of pixels. Say a product page ships a 1.8 MB hero PNG to a 390-pixel-wide phone. Resized to roughly 780 pixels wide and converted to AVIF, the same visual lands well under 100 KB, and LCP on a mid-range Android over throttled 4G typically falls from around 4 seconds to comfortably inside the Good band.
- Cut server response time with page caching and a CDN, because no image trick rescues a first byte that arrives after a second.
- Inline the critical CSS for the top of the page and load the rest without blocking render.
Here's the trace being read end to end, if you prefer watching to reading.
Fonts and CSS That Block the First Paint
Web fonts are the quiet LCP killers. The browser often can't paint the headline until the font arrives, so limit yourself to the one or two weights used above the fold, serve WOFF2, and preload the critical file. If you're unsure which fonts are critical, this walkthrough on font preloading for front-end teams shows how to identify and verify them. For the wider set of asset and script changes that support a fast LCP, these website performance optimization techniques are a sensible second pass.
Closing check: in the waterfall, the LCP image request should start near the top. If it begins after three other requests, you have a discovery problem, not a bandwidth problem.
Lazy-Load Only the Parts Below the Fold
Lazy loading has a reputation it hasn't earned: the assumption that adding loading="lazy" to everything automatically speeds a page up. It doesn't. Web.dev reports a correlation in which the median page without lazy loading had a 75th-percentile LCP of 2,922 milliseconds, against 3,546 milliseconds for the median page with it, and among WordPress pages the figures were 3,495 and 3,768 milliseconds, according to Web.dev's research on LCP and lazy loading. Correlation isn't causation, since the two groups of pages differ in content and implementation, but the direction is a warning worth heeding.
The attribute isn't the problem. Applying it indiscriminately is.
- Defer what's distant: footer galleries, comment avatars, related-product grids, review carousels, map embeds halfway down a store locator page.
- Keep the first carousel slide eager and defer slides two onward, since the visitor sees slide one immediately.
- Keep the hero eager, always. That's the one resource you want the browser to fight for.
- Defer iframes, not just images. Video players and third-party embeds are heavier than most images and rarely needed above the fold.
To verify, throttle the network in DevTools, scroll slowly, and watch for anything that pops in late when a real visitor reaches it. A gallery that arrives two seconds after you scroll to it isn't optimized, it's just hidden.
The wizard's rule: keep the opening spell ready and let the distant creatures sleep until someone walks toward them.
Then audit every img and iframe tag on your worst template and mark three columns: above the fold, is it the LCP element, does it currently carry loading="lazy". Anything that answers yes, yes, yes is costing you time on every single visit.
Stop Layout Shifts Before They Start
Layout shifts are the poltergeists of the page: invisible until they move something, and infuriating precisely because the visitor was mid-action. Someone reaches for the checkout button, a late ad slot heaves the content down, and they tap the wrong thing. Group the causes by who controls them, because the fixes differ.
Causes You Control
Images and videos without dimensions are the classic. Set explicit width and height attributes, or wrap the element in an aspect-ratio box, so the browser reserves the space before the file arrives. Content inserted above what someone is already reading is the second, usually a late recommendation bar or a promo banner, and the fix is to place it below existing content or reserve its height upfront. Web fonts that swap in with different metrics shrink or stretch text after paint, so pair font-display with a fallback font whose size and line height are adjusted to match. And animate with transform rather than top or left, since transforms don't trigger layout.
Causes You Don't
Ad slots and embeds inject creative the moment an auction closes, so give each container a minimum height matching the expected creative and let the slot fill it. Consent banners that push the page down should be overlays or fixed bars instead. Say a blog gives its header images fixed dimensions and reserves a slot for its newsletter bar: the visible jumps mostly stop within a week of deploying, and the remaining shift usually traces back to a third-party script.
To find the culprit, open DevTools Performance, enable Layout Shift Regions, reload the page, and watch which elements flash purple and when. The answer is usually a script you didn't write.
Speed Up Slow Interactions Without Breaking Checkout
A shopper on a mid-range Android phone taps Pay. The button stays dead while a script finishes the order summary, so they tap again. The second tap double-submits, or they leave. That gap is where INP fails, and the misses cluster on phones. Desktop sessions often look fine, so a laptop walk through menus, forms, cart updates, checkout validation, and chat widgets builds false confidence. Judge the change on field data at the 75th percentile. If the slower quarter of real phone visits still waits, a clean lab score did not fix the page.
Find the Goblins Behind the Buttons
Long tasks are the goblins. Any JavaScript that holds the main thread for more than 50 milliseconds without yielding freezes every tap queued behind it. On a smaller phone CPU, one unyielded task is the whole interaction.
I would record the tap on a real mid-range Android device, not a laptop with CPU throttling standing in for one. In the Performance panel, mark that interaction, find the long tasks the click started, and split the work into chunks that hand control back between rendering phases. Defer chat widgets, tag managers, and social embeds until after the first interaction or until the browser is idle. Inside handlers, debounce search-as-you-type, skip re-rendering a whole product list when one quantity changes, and move non-urgent logic out of the click path.
Rank by revenue and mobile latency together. The add-to-cart tap matters more than a privacy toggle nobody touches, even when both show similar INP. Checkout validation and cart updates need their own pass, because a sluggish response there costs the order. Before you refactor validation, these checkout page optimization practices cover the funnel steps that overlap with responsiveness.
Measure the outcome, not just the metric. After a fix, check whether the completion rate for that step rose. A lower INP with the same abandonment rate means you optimized the wrong interaction.
Never ship a responsiveness change to checkout without running the full purchase journey on real hardware first. Faster feedback that breaks a step is a net loss. A perfect trace on your desk is not the 75th percentile visitor.
Prioritize Your Fixes and Confirm the Gains
Start with the metric that fails across the most visits on your most valuable template, then match the symptom to a first fix and a proof condition.
| Field symptom | Metric | First fix | Proof it worked |
|---|---|---|---|
| Hero image appears late | LCP | Remove lazy loading, add fetchpriority, preload the image | LCP at 2.5 seconds or less on mobile |
| Slow server response | LCP | Add caching and a CDN for HTML responses | Lower time to first byte and a falling LCP trend |
| Content jumps while loading | CLS | Set width, height or aspect-ratio on media and embeds | CLS at 0.1 or less at the 75th percentile |
| Taps feel laggy on phones | INP | Split long tasks and defer third-party scripts | INP at 200 milliseconds or less on mobile |
| Fine on desktop, poor on mobile | INP and LCP | Test on a mid-range Android device with a throttled network | Mobile field pass rate rises |
Ship one fix per template at a time, give each one a named owner, and resist judging it on a single day's data. If you want more options ranked by effort against payoff, these practical fixes for web performance from Netco Design LLC go broader than the five symptoms above.
Make the Gains Stick
A fix that isn't defended decays within a couple of releases, usually the week someone adds a chat widget to every template.
- Set per-template budgets: the LCP image discovered in the initial HTML, main-thread blocking held under an agreed limit per interaction, zero unexpected layout movement.
- Enforce them in CI with Lighthouse or trace-based checks so a regression fails the build rather than surfacing in the field three weeks later.
- Watch field data after every release, and when a number slips, walk back through the measurement workflow instead of guessing at a cause.
Automation removes most of the discipline problem here. Every Web Mage site includes four built-in AI agents called familiars that run automatically every 24 hours with no manual setup: Speed Sprite compresses images and monitors page speed, and Analytics Oracle reads site analytics to surface visitors who stall or abandon.
Which template has your worst mobile 75th percentile today, and what will that number read after the first fix?
Speed work stalls when nobody owns the boring half: the daily checking, the image compression, the drift that creeps in with every new script. Web Mage builds the page from a plain-English description and then keeps optimizing it, with familiars that patrol performance and analytics on a 24-hour cycle so the numbers you just fixed don't rot unnoticed. If you'd rather spend your time on offers than on waterfalls, Web Mage will hand you a live site and keep the speed patrol running.