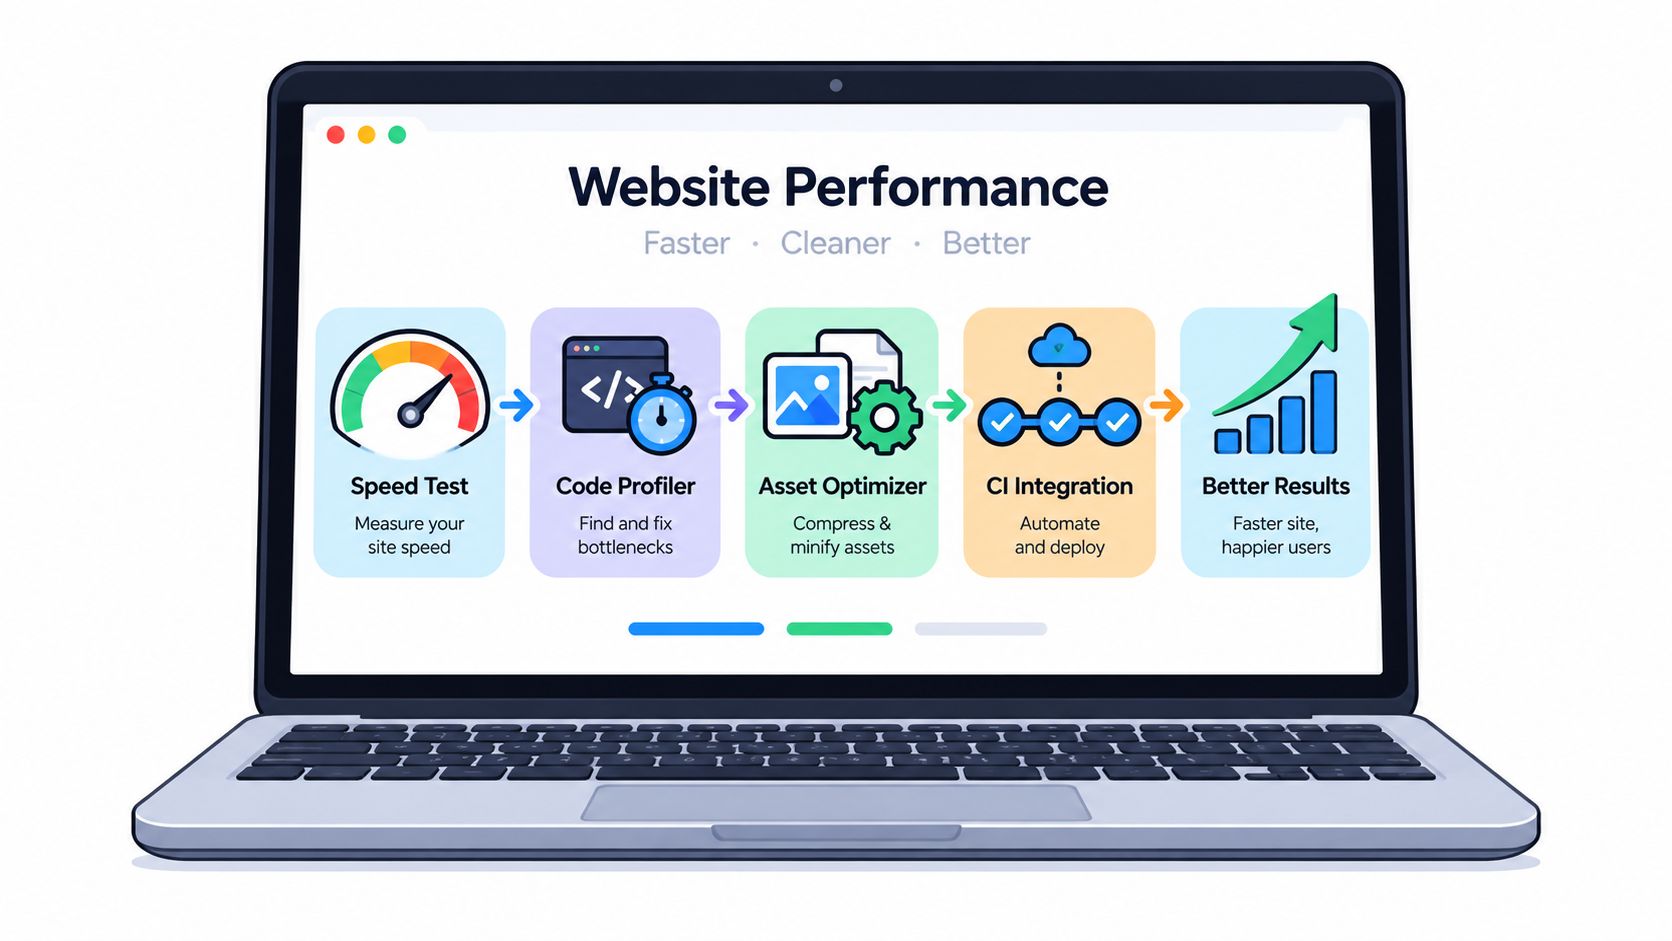
A single score won't make a slow site fast. Neither will one website performance optimization tool, no matter how polished its dashboard looks. A lab score can point toward a problem while real visitors struggle with a different one, and an optimization plugin can shave weight from a page while breaking a checkout flow.
The useful approach is a workflow. Establish a baseline with field and lab data, diagnose the bottleneck with traces and waterfalls, apply the right delivery or asset fix, then monitor releases so yesterday's improvement doesn't vanish in today's deployment. Google's Core Web Vitals framework uses LCP, INP, and CLS, with good thresholds of 2.5 seconds or less, 200 milliseconds or less, and 0.1 or less, respectively, assessed at the 75th percentile across mobile and desktop loads (Google's Core Web Vitals guidance).
This roundup follows that practical sequence. Web Mage is the broad, AI-first option, combining site creation with autonomous performance, SEO, analytics, and conversion work. The other tools are sharper instruments, built for testing, tracing, monitoring, edge delivery, or WordPress optimization. Choose the spell that matches the job, not the flashiest wand.
Table of Contents
- 1. Web Mage, AI Website and Funnel Builder, Launch in Seconds
- 2. Google PageSpeed Insights
- 3. WebPageTest by Catchpoint
- 4. GTmetrix
- 5. SpeedCurve
- 6. Calibre
- 7. DebugBear
- 8. Cloudflare Performance Stack and APO
- 9. NitroPack
- 10. WP Rocket for WordPress
- Top 10 Website Performance Tools Compared
- Build Your Site-Speed Spellbook
1. Web Mage, AI Website and Funnel Builder, Launch in Seconds
Web Mage is for teams that don't want to assemble a website from templates, hosting, analytics, testing software, and optimization plugins before they can publish anything. You describe the page or funnel in plain language, and the platform generates the structure, copy, imagery, styling, and flow. A one-sentence prompt can produce connected landing, checkout, upsell, and thank-you pages, while chat commands handle later edits.
The performance angle comes from its resident agents. Speed Sprite compresses assets, lazy-loads media, and prunes unnecessary payload. SEO Seer checks metadata and links nightly. Analytics Oracle surfaces drop-offs and priorities, while Conversion Alchemist drafts variants, routes traffic, and promotes winning experiments. That gives small teams a single place to act instead of exporting a report and hoping someone remembers it during the next sprint.

When Web Mage earns its spellbook
Use Web Mage when speed of creation and ongoing upkeep matter as much as granular engineering control. Product examples cite LCP improvements such as 2.4 seconds to 1.1 seconds, and a +18% CTR example on a pricing page. Those are product examples, not a promise for every site, so validate the result with your own field and lab data.
The base plan is $8 per month with 500 credits, with top-ups available and purchased credits that don't expire. Hosting, SSL, analytics, SEO functions, and a .webmage.site subdomain are included. Custom-domain support and advanced enterprise details aren't clearly documented on the product page, and heavier usage may require additional credits.
Practical rule: Treat autonomous optimization as a helpful resident mage, not an exemption from reviewing changes. Check important pages, forms, tracking, and brand details after automated edits.
The trade-off is control. Prompt-driven generation is quicker than manually shaping every layout, but teams that need exact component behavior or an unusual design system may prefer a traditional builder or custom stack. For solo founders, marketers, agencies, and small businesses, Web Mage's strongest magic is consolidation: create, host, measure, test, and tune without stitching together a sprawling toolchain. See how to build a website with AI for the prompt-driven workflow.
2. Google PageSpeed Insights
Google PageSpeed Insights is the right opening ritual for most investigations because it combines CrUX field data with Lighthouse lab data in one report. Enter a URL, run mobile and desktop analyses, and separate what real visitors experience from what a controlled test observes. That distinction prevents a common mistake, treating a clean lab run as proof that every audience segment is comfortable.
The report organizes recommendations around Core Web Vitals and points toward likely fixes for LCP, INP, and CLS. Google's guidance makes LCP a concrete target, with the largest visible element expected within the first 2.5 seconds for a good experience (Google's LCP documentation).
Turning a report into a fix
Start with the field classification, then use the lab audits to investigate. If LCP is poor, inspect the largest element, server response, request priority, and image delivery. If INP fails while LCP looks acceptable, look for long JavaScript tasks, third-party scripts, and interaction handlers that keep the main thread busy. For CLS, reserve space for images, embeds, and dynamic content before it arrives.
PSI is free and requires no account, which makes it useful for client conversations and quick release checks. It isn't a continuous monitoring system by default, though, and lab conditions can differ sharply from the devices, networks, and locations represented in field data. Use it as the baseline, not the whole observatory.
For a practical companion workflow, see how to optimize website speed. The result should be a ticket with an owner and a testable change, not a screenshot of a score.
3. WebPageTest by Catchpoint
WebPageTest is where a vague complaint such as “the page feels slow” becomes a sequence of network, browser, and rendering events. It supports tests from multiple locations and browsers, with repeat views, filmstrips, rich waterfalls, scripting, and no-code experiments. That depth makes it particularly effective when the same URL behaves differently for visitors in different regions or after the cache is warm.
The waterfall is the dragon map. Follow the critical path from the document request through stylesheets, scripts, fonts, and the LCP resource. A long chain often points to sequencing rather than raw file size. A third-party script that starts early and competes with the hero image may deserve delay, removal, or a lower loading priority.
Where the trace becomes implementation work
Use scripting to reproduce logged-in flows, consent states, or checkout paths that a simple URL test misses. Compare a baseline with a candidate change, such as preloading the actual hero image, deferring a non-critical script, or removing an analytics tag. Filmstrips help verify that the page looks better at the same time the metrics improve.
WebPageTest also exposes third-party and critical-path behavior more clearly than lightweight testers. API access supports automation and CI, although teams must understand the test configuration well enough to avoid comparing unlike runs. Its learning curve is steeper, and the free tier has run limits. Heavier use requires paid plans, so the tool makes most sense when engineers need forensic detail rather than a friendly grade.
A waterfall doesn't tell you to “optimize JavaScript.” It shows which request blocks which visible outcome. Fix that relationship first.
Its magic stops at diagnosis. WebPageTest won't automatically rewrite your application architecture or decide whether a business-critical script can disappear. The practitioner still has to make the change, test the behavior, and verify that the cure hasn't damaged the funnel.
4. GTmetrix
GTmetrix is a strong compromise between a deep engineering trace and a report a marketer can easily read. It combines Lighthouse analysis with its own grading model, Core Web Vitals reporting, and waterfall diagnostics. The interface makes it easy to show a page owner which resources load late, which audits fail, and which changes deserve attention first.
Use it for recurring checks on important templates, especially when stakeholders need a readable history rather than raw browser traces. Paid tiers add more global test locations, scheduled monitoring, historical data, bulk testing, and repeatable presets. The higher plans offer 25 or more global test locations, according to the product plan notes, making regional comparisons practical for distributed audiences.
The useful middle ground
A common workflow is to save a test configuration for mobile, a chosen location, and a representative page type. Run it after a release, compare the waterfall with the previous result, and inspect whether the same resources remain responsible for the delay. If a new personalization script appears near the start of the request chain, the action might be to delay it, remove it from the template, or load it only after consent.
GTmetrix works well for agencies because its output can support a client explanation without flattening the technical story. It isn't field data, however. A lab run can look healthier than real-user experience when the test device, network, cache state, or geographic location doesn't match the audience.
The free plan has location and feature limits, so scheduled governance eventually becomes a paid decision. Its magic is clarity and repeatability, not autonomous remediation. Pair it with field data when you need to know whether the fix helped actual visitors.
5. SpeedCurve
SpeedCurve treats performance as an operating discipline rather than a launch-day exorcism. It combines synthetic testing with Real User Monitoring, Core Web Vitals dashboards, performance budgets, alerts, and CI/CD tooling. That makes it useful for organizations where several teams can change the same site and nobody wants to discover a regression through an angry customer.
Set budgets around the metrics and page types that matter. A product page, checkout step, and editorial article may need different expectations, and a single site-wide threshold can hide template-specific damage. When a budget fails, connect the alert to a release, inspect the change, and compare both synthetic traces and RUM segments before rolling anything back.
Governance without score worship
SpeedCurve's organization-level views help identify trends and third-party impact across teams. You can see whether a tag, vendor, or release repeatedly adds pressure to the experience. CI and CLI integrations can fail builds when a regression crosses an agreed boundary, turning performance from a best-effort promise into a release condition.
The trade-off is setup. This is a paid product with tiered pricing based on checks and page views, and teams need a clear measurement plan before the dashboards become useful. Buying monitoring without assigning ownership creates a very expensive crystal ball.
Field data deserves priority for user experience decisions. Google classifies Core Web Vitals from real page views at the 75th percentile, and a metric is good only when the required share of views meets its threshold (the Core Web Vitals threshold explanation). SpeedCurve helps operationalize that reality, but it won't repair a slow component by itself. Its magic is keeping the warning bell loud enough that regressions can't hide in the release fog.
6. Calibre
Calibre is built for teams that want continuous monitoring with developer-friendly workflows. Scheduled synthetic tests, optional RUM, CrUX context, performance budgets, alerts, APIs, and team dashboards all point toward one job: make performance review part of normal delivery rather than a sporadic audit.
The practical value appears after the first baseline. Choose representative URLs, establish budgets for their key metrics, and connect alerts to the channels where developers already work. When a page crosses a limit, compare the current request profile with the previous run, identify the changed asset or script, and reproduce the issue before touching production configuration.
A calmer release ritual
Calibre's RUM and CrUX views help prevent overconfidence in synthetic tests. A lab run can isolate a controlled change, while field context shows whether visitors on slower devices or networks experience the same improvement. That pairing is especially useful for interaction problems, where a page may paint quickly but still respond sluggishly after a user opens a menu or submits a form.
The product is paid, and estimating test allocations takes planning. Its JavaScript-heavy application can also make pricing details less immediately accessible, which isn't ideal when procurement needs a quick answer. Those aren't deal-breakers, but they reinforce the need to define page coverage and alert ownership before subscribing.
Calibre's magic is governance with a developer accent. It won't replace a waterfall investigation or an edge configuration, and it won't make an unreasonable budget reasonable. It gives teams the recurring evidence and integration points needed to keep good work alive.
7. DebugBear
DebugBear is aimed at the moment after a generic audit says “reduce JavaScript” and leaves you holding the shovel. It combines Lighthouse-based synthetic testing, RUM, CrUX insights, request-chain views, INP analysis, API access, quick tests, and experiment workflows. The useful detail is causal: which interaction is slow, which script blocks it, and which request sequence delays the visible result.
Use it when LCP looks acceptable but INP fails. INP reflects interaction behavior across the page, so inspect long tasks, hydration work, third-party scripts, and the elements associated with slow responses rather than hunting for a single bad click. A concrete fix might be splitting a large bundle, delaying a chat widget, reducing hydration on an interactive component, or moving non-essential work away from the interaction path.
From diagnosis to controlled experiment
DebugBear's experiment workflows let teams test a proposed change before committing to a production deployment. Compare the original page with a version that alters HTML, resource loading, or script behavior, then confirm both the metric movement and the visual result. The test only earns promotion when the page still functions, tracks correctly, and behaves properly on the important path.
AI-assisted fix prompts can help translate findings into implementation ideas, but they don't know every product constraint. An experiment that removes a script may improve a score while disabling consent handling, personalization, or payment behavior.
The platform is paid-focused, and advanced features may require onboarding. That setup is worthwhile for agencies and engineering teams managing many pages, but it may be more machinery than a small site needs. DebugBear's magic stops at the boundary between evidence and judgment. It can illuminate the spell ingredients, but a human still decides what belongs in production.
8. Cloudflare Performance Stack and APO
Cloudflare works lower in the stack than most page testers. Its CDN, caching, image optimization, Brotli compression, HTTP/3 support, Early Hints, Automatic Platform Optimization for WordPress, and Browser Insights can improve delivery across geographies when configured correctly. A page can be perfectly compressed and still wait on a distant origin or a slow dynamic response.
For WordPress, APO can cache dynamic pages at the edge rather than sending every request back to the origin. Start with a small set of caching rules, purge deliberately, and verify personalized, authenticated, cart, and checkout paths before expanding coverage. A cached marketing page and a user-specific account page should never be treated as the same creature.
Edge power needs a safety circle
Cloudflare reports real-user performance through Browser Insights, which helps connect delivery changes with visitor experience. It also supports modern protocol and compression features, but availability and inclusion vary by plan. Some optimization and add-on usage is billed separately, so the apparently simple edge spell can become a nuanced pricing and configuration exercise.
Protect the origin: Test cache behavior, invalidation, cookies, forms, and redirects before calling an edge configuration finished.
CDN adoption already exceeds 70% among top sites, while HTTP/3 support has reached 31% of websites, according to independent site-speed statistics. Those figures signal a broader shift toward network and protocol improvements, not a reason to skip page-level diagnosis.
Cloudflare's magic stops when the origin sends the wrong content, the application performs expensive work, or a third-party script blocks interaction in the browser. It accelerates delivery, but it can't turn a tangled application into a clean one. For the relationship between hosting and site-building choices, website hosting and builder guidance offers useful context.
9. NitroPack
NitroPack bundles caching, HTML, CSS, and JavaScript optimization, image handling, lazy loading, critical CSS generation, and CDN delivery into a cloud-based layer. It suits owners who want a quick path from “this page is heavy” to “the optimization system is active” without assembling several plugins and services.
Use test mode before enabling aggressive settings across a live site. Compare the optimized page with the original, then inspect navigation menus, forms, product filters, animations, consent tools, and checkout behavior. A performance layer can improve the initial render while interfering with code that expects a particular execution order.
The shortcut has edges
NitroPack's presets are convenient for non-technical users, and its handling of CSS background images and critical CSS can address problems that basic lazy loading misses. The practical fix is still iterative: enable a focused mode, test representative templates, inspect the waterfall, and verify Core Web Vitals in both lab and field data.
The risks are familiar. Aggressive optimization can conflict with themes, plugins, and custom scripts. Pricing tiers and feature access have changed over time, so review the current plan rather than relying on an old comparison or remembered limit.
NitroPack is strongest when configuration time is more expensive than fine-grained control. It isn't a substitute for understanding why a page is slow, and it won't rescue an origin that fails under application load. Its magic is a consolidated optimization layer, with a clear warning label around compatibility.
10. WP Rocket for WordPress
WP Rocket is a premium WordPress plugin for the familiar problems of page caching and front-end delivery. It supports file optimization, preload rules, lazy loading, removal of unused CSS, delayed or deferred JavaScript, database cleanup, and CDN compatibility. For a WordPress team that wants faster time-to-value than a pile of free plugins, its consolidated interface is attractive.
A sensible rollout starts with page caching and a clean test of the public site. Add one optimization at a time, then check layouts, menus, search, forms, logged-in states, and commerce paths. Delaying JavaScript can help the main content appear sooner, but it can also postpone a dependency that a theme or plugin expects immediately.
WordPress convenience versus control
WP Rocket's wide theme and plugin compatibility is useful, but compatibility isn't automatic. Remove unused CSS and script delay settings deserve particular care on sites with visual builders, interactive navigation, payment widgets, or personalization. Keep a rollback path and test on staging when the site earns meaningful revenue.
There is no free tier, and licensing and pricing changes have frustrated some users. That doesn't make the plugin a poor choice, but it does make current plan review part of the buying process. Pairing it with a CDN can address geographic delivery while WP Rocket handles page-level behavior.
Its magic stops at the WordPress boundary. It won't diagnose every third-party dependency, replace field monitoring, or guarantee that a plugin update won't change the page. Use WP Rocket's website optimization tools overview as background, then measure your own templates instead of trusting an activation checklist.
Top 10 Website Performance Tools Compared
| Product | Core capability | Automation & optimization | Best for | Price / Model |
|---|---|---|---|---|
| Web Mage, AI Website & Funnel Builder | Prompt-to-page + one-sentence funnels, chat edits, copy & imagery, managed hosting | Nightly SEO Seer; Speed Sprite performance tuning; Analytics Oracle; Conversion Alchemist with auto A/B promotion | Solo founders, marketers, small teams who want instant builds + continuous optimization | $8/mo (500 credits), credit top-ups; hosting & SSL included |
| Google PageSpeed Insights (PSI) | URL performance audit with CrUX (field) + Lighthouse (lab) | One-off reports; no built-in continuous monitoring | Quick diagnostics and SEO-aligned benchmarking | Free |
| WebPageTest (by Catchpoint) | Deep synthetic traces, waterfalls, filmstrips, scripting, multi-location | API & CI integration for automated runs; repeatable scripting | Engineers and performance specialists requiring granular lab diagnostics | Free tier; paid plans for heavy/enterprise use |
| GTmetrix | Lighthouse-based reports, waterfall, easy-to-read scores | Scheduled monitors & history on PRO tiers | Non-engineers and small teams needing simple diagnostics & scheduled checks | Free limited plan; PRO paid tiers |
| SpeedCurve | RUM + synthetic dashboards, performance budgets, CI/CD hooks | Continuous monitoring, alerts, budgets to prevent regressions | Teams/governance-focused orgs tracking trends and third-party impact | Paid, tiered by checks/pageviews |
| Calibre | Continuous synthetic tests, optional RUM, budgets, APIs for CI | Scheduled tests, alerts, dashboards tuned to Web Vitals | Dev teams wanting automated monitoring and CI integration | Paid (plans based on test allocations) |
| DebugBear | Synthetic + RUM + CrUX, INP analysis, request-chain debugging, AI fix prompts | Alerts, experiment workflows, API for automation | Agencies and developers needing actionable debugging at scale | Paid (pricing not prominently free) |
| Cloudflare (Performance Stack + APO) | Global CDN, edge caching, image optimization (Polish), HTTP/3, APO for WordPress | Edge caching + APO auto-serve; Browser Insights for RUM | Sites needing global acceleration and reduced TTFB | Generous free tier; some features/add-ons paid |
| NitroPack | All-in-one caching, minify, image opt, lazy-load, critical CSS | Hands-off presets and test mode for changes | Non-technical site owners wanting quick Web Vitals gains | Paid tiers (varies by site traffic) |
| WP Rocket (WordPress) | Page caching, defer/delay JS, remove unused CSS, preloads | Manual configuration; integrates with CDNs | WordPress site owners seeking fast time-to-value optimizations | Paid license (no free tier) |
Build Your Site-Speed Spellbook
There isn't one universal winner because the tools solve different problems. Start with Google PageSpeed Insights when you need an accessible baseline that combines field and lab signals. Use WebPageTest when a waterfall, filmstrip, script, or regional comparison must explain the bottleneck. Choose GTmetrix for readable recurring checks that clients and non-engineers can follow without losing the underlying diagnostics.
For governance, SpeedCurve and Calibre are the stronger choices when budgets, alerts, RUM, and CI integration need to become part of release practice. DebugBear is a good fit when the team needs actionable debugging around request chains and INP drivers, especially when a simple score doesn't explain the interaction problem. These tools require setup, ownership, and a willingness to act on alerts. A dashboard without a remediation path is just a very polished cupboard.
The delivery and optimization layers belong later in the workflow. Cloudflare is the edge choice when caching, origin distance, protocol support, and global delivery are central concerns. NitroPack offers a bundled, hands-off optimization layer for teams willing to test compatibility carefully. WP Rocket suits WordPress owners who want caching and front-end controls in a familiar plugin, with the usual caution around delayed scripts, unused CSS, and plugin interactions.
Web Mage belongs in a different category. It isn't only a measurement or delivery instrument. It targets teams that want prompt-driven site and funnel creation plus autonomous ongoing work across performance, SEO, analytics, and conversion. Speed Sprite handles asset and loading hygiene, SEO Seer checks metadata and links, Analytics Oracle surfaces behavior, and Conversion Alchemist supports built-in experimentation. The convenience is substantial for solo founders, marketers, agencies, and small teams, while the trade-off is less fine-grained manual control than a custom build.
A practical selection sequence looks like this:
- Measure both realities: Use PSI or another field-aware tool for visitor experience, then run WebPageTest or GTmetrix to reproduce the page in a controlled environment.
- Name the bottleneck: Decide whether the issue is LCP delivery, INP pressure, CLS instability, server response, third-party code, image weight, or cache behavior.
- Change one meaningful variable: Delay one script, alter one image delivery path, adjust one cache rule, or remove one blocking dependency.
- Retest the behavior: Compare the metric, waterfall, filmstrip, and functional path. A faster page that loses its menu or checkout isn't an improvement.
- Verify field experience: Watch RUM and CrUX context long enough to distinguish a genuine improvement from a lucky lab run.
- Protect the result: Add a budget, scheduled check, alert, or build gate through SpeedCurve, Calibre, DebugBear, GTmetrix, or your CI system.
Core Web Vitals remain a practical acceptance language because Google evaluates real user data and uses the 75th percentile rather than a single heroic visit. Yet performance is broader than three numbers. The best website performance optimization tool is the one that helps your team identify a real user problem, make a safe change, and notice when the dragon returns.
Web Mage turns plain-language prompts into complete websites and funnels, then keeps working through autonomous agents for performance, SEO, analytics, and conversion optimization. If you want a single platform that combines fast creation with ongoing site-speed care, visit Web Mage and start building your performance spellbook.