You've paid for the click, written the headline, and polished the offer. Then a visitor on a mid-range phone taps your ad, stares at a blank screen, and watches a spinner turn like a tiny cursed carousel. They don't wait to meet your product. They leave.
Slow to load web pages aren't one problem with one spell to fix them. A page can appear quickly and still ignore taps, jump around, or get slower every month as pixie-sized scripts pile up in the rafters. I would treat speed like a wizard treats a crystal ball. Read the right signs first, name the creature causing the trouble, then cast fixes in an order that doesn't create a second curse while lifting the first.
Table of Contents
- The Three Numbers That Decide Whether Your Page Feels Slow
- Find the Real Bottleneck Before You Touch Anything
- Match Each Symptom to Its Likely Cause
- How to Speed Up the Loading Phase in Order
- Why a Page Looks Ready but Still Feels Slow
- Keep Speed From Drifting After Launch
The Three Numbers That Decide Whether Your Page Feels Slow
That blank-screen moment is where money leaks out. In Google's Mobile Site Speed Playbook, Google reported that 53% of mobile visitors leave when a page takes more than three seconds to load. The same testing found bounce rates averaged about 13% for pages loading in under three seconds but rose to nearly 60% when loading took more than nine seconds.
Those aren't vanity numbers for engineers. Every extra second gives your visitor more time to doubt, get distracted, or tap back to a competitor whose page already answered. On mobile, weaker processors and patchy connections turn a small delay on your laptop into a long, expensive silence on someone else's phone.
The Three Signs in the Crystal Ball
Google judges that experience with Core Web Vitals, three numbers that describe different kinds of slowness. Largest Contentful Paint, or LCP, tells you when the main content becomes visible. Interaction to Next Paint, or INP, tells you how long a tap or click waits before the page paints a response. Cumulative Layout Shift, or CLS, tells you whether text and buttons jump around while the page settles.
Think of them as three different gremlins. One hides your hero image. One sits on your buttons. One keeps moving the furniture while visitors try to sit down.
| Metric | What It Measures | Good Threshold | Usual Culprit |
|---|---|---|---|
| LCP (Largest Contentful Paint) | When the main content becomes visible | 2.5 seconds or less | Slow server response, late hero image, render-blocking CSS |
| INP (Interaction to Next Paint) | Delay from a tap or click to the next painted frame | 200 milliseconds or less | Heavy JavaScript, long tasks, chat widgets and tags |
| CLS (Cumulative Layout Shift) | Unexpected movement of content while the page loads | 0.1 or less | Images, ads or embeds without reserved space |
Practical rule: Your page is graded by its weakest number, so a fast hero image can't hide a laggy checkout button.
Before you change anything, note which row your page fails. That single decision stops the most common waste of effort, which is compressing images for a page whose real problem is a script-hungry dragon sitting on every tap.
Find the Real Bottleneck Before You Touch Anything
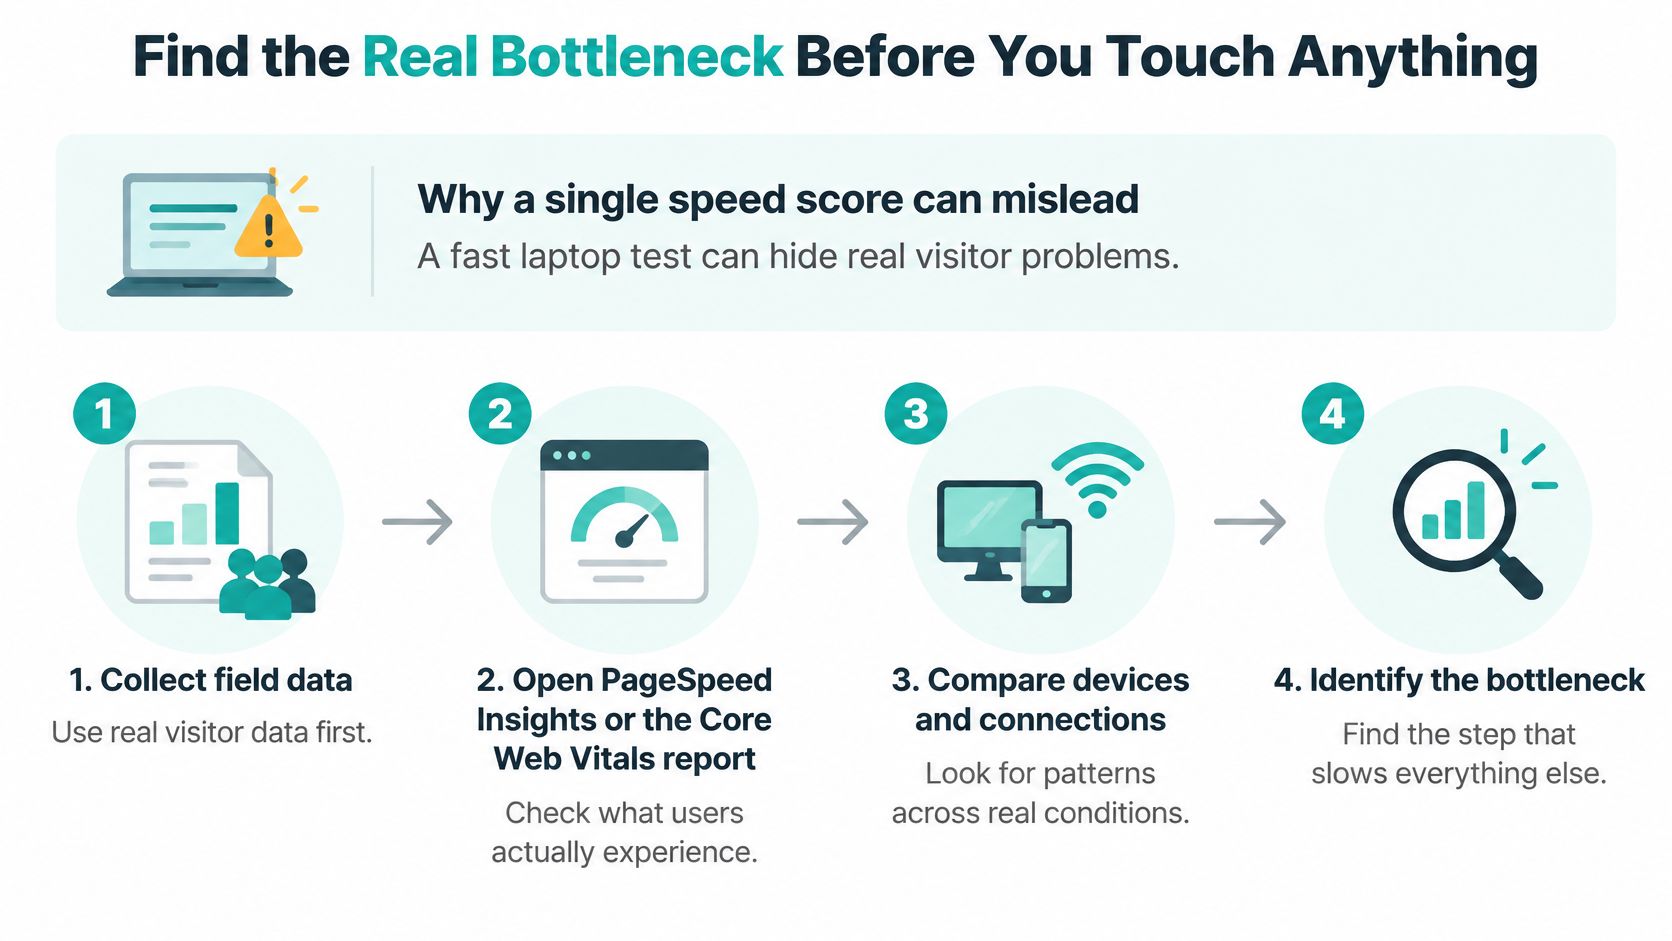
A single speed score from your fast laptop is a fortune teller working with one card. It might look impressive, but it doesn't describe a visitor on a train, an older Android phone, or a congested evening network. Field data, collected from real visitors, beats one heroic lab run every time.
Segment real-user data by mobile and desktop, geography, connection type, browser, and page template, then read the 75th percentile for LCP, INP, and CLS, as set out in the HTTP Archive tech report. That percentile means three in four visitors get an experience at least that good, and the rest get something worse.
A Field-First Workflow That Takes Minutes
- Open the field report first. Run your URL through PageSpeed Insights or open the Core Web Vitals report in Google Search Console, then split mobile from desktop before you look at anything else.
- Record the failing metric by template. A product page, a blog post, and a checkout page break for different reasons, so write down which template fails and which number fails on it.
- Reproduce it under throttling. Use Chrome DevTools or WebPageTest with mobile CPU and network limits turned on, then record the request chain to see which file arrives last.
- Compare lab against field. If the lab trace blames a hero image and field data blames INP, don't average them into a guess. Find out why real visitors hit a different bottleneck.
- Pick the largest shared bottleneck. Fix the cause that appears across the most templates first, because one shared script or image pattern can curse your whole site at once.
| Tool | Data Type | Best For |
|---|---|---|
| PageSpeed Insights | Field data over 28 days plus a lab test | Checking the 75th percentile that real visitors experience |
| Chrome DevTools (Lighthouse and Performance panel) | Lab test on your device with throttling | Reproducing a slow load on a simulated phone |
| WebPageTest | Lab test with a request waterfall | Seeing which file blocks the page and when it arrives |
| Chrome UX Report | Field data aggregated across many sites | Benchmarking your results against typical sites |
If your site is too new or too quiet to appear in field reports, run WebPageTest with a mobile profile from two or three locations and treat that trace as a stand-in until real data arrives. Your choice of host and builder shapes how much of this plumbing you control directly, which is why it's worth understanding how website hosting and builder platforms handle delivery before you blame the page itself.
A fix only counts once the next field window confirms it. One green lab score is a promising omen, not proof the curse is broken.
Match Each Symptom to Its Likely Cause
Most site owners don't arrive holding a metric. They arrive holding a symptom, usually phrased as "it feels weird on my phone." That feeling is useful evidence if you translate it into a place to look instead of treating it as a vague complaint.
Say a bakery runs a simple landing page for weekend pre-orders. It loaded fine for months. Then the owner adds a review carousel and a chat bubble in the same week, and suddenly the order button feels sticky and the headline jumps when the reviews arrive. Nothing about the photos changed, so compressing the photos would be casting a fine spell on the wrong creature.
Reading Symptoms Like Tracks in the Forest
A blank screen points early in the loading chain, before content can render. A hero image arriving last points at discovery, because the browser found that image late or deprioritized it. Jumping text points at missing dimensions, while laggy taps point at JavaScript hogging the main thread, the browser's single workbench where rendering and interaction compete for space.
| Symptom | Likely Cause | Where to Look |
|---|---|---|
| Blank screen for 3+ seconds on phones | Slow server response or render-blocking CSS | Waterfall showing time to first byte and early CSS requests |
| Hero image appears last | Hero image lazy-loaded or hidden in a CSS background | LCP element shown in PageSpeed Insights |
| Text and buttons jump while loading | Images, ads or embeds without reserved size | Layout shift culprits in the DevTools Performance panel |
| Taps lag or miss the button | Long JavaScript tasks from tags and widgets | INP breakdown in field data and the Performance panel |
| Fast on desktop, slow on phones | Mobile CPU and network limits | Throttled mobile run in Lighthouse |
| Slower every month | New scripts, pop-ups and media added over time | Third-party request count and sizes in the waterfall |
Symptoms can overlap, and that's normal. A late hero image and a jumping layout often travel together, because the image arrives without reserved space and shoves everything below it. The table gives you a first suspect, not a final verdict.
Rank symptoms by how many visitors actually hit them, using field data split by device, and start with the one affecting the most people.
I would resist fixing the symptom that annoys you most on your own phone. Fix the one your visitors meet most often, because that's where the recovered revenue lives.
How to Speed Up the Loading Phase in Order
Loading fixes depend on each other, so order matters more than enthusiasm. Preloading an image won't help much if the server takes ages to answer, and compressing a photo won't help if the browser discovers it last. Work down the chain the way a careful mage stacks rune stones, one stable layer at a time.

Six Steps in the Right Sequence
- Cut the server wait first. Measure time to first byte in your waterfall, turn on caching, and check whether static files are served through a CDN. A CDN delivers files from closer to the visitor, but it can't rescue a slow database query generating the page behind the scenes. If the first byte is late, everything downstream starts late.
- Preload only the true hero. Find your LCP element in PageSpeed Insights and preload that one image, or the one critical font, so the browser fetches it immediately. Preloading five assets turns a priority lane into a traffic jam, because every "urgent" file competes for the same bandwidth.
- Serve images at the size they're shown. Resize to the displayed width, use srcset so phones download smaller files than desktops, and convert to WebP or AVIF where you can. A wide desktop photo squeezed into a phone-width slot wastes most of its bytes on pixels nobody ever sees.
- Lazy-load below the fold only. Images further down the page can wait until the visitor scrolls toward them. The hero image cannot, and lazy-loading it is the most common self-inflicted wound in this whole grimoire.
- Set cache headers on static assets. Returning visitors shouldn't re-download your logo, fonts, and scripts on every visit. Sensible caching turns repeat visits into near-instant loads, which matters most for customers who come back to buy again.
- Reserve space for everything. Give every image, video, and embed a width and height, or an aspect ratio in CSS, so the layout holds its shape while files arrive. This one habit kills most layout shift before it starts.
These steps cover the loading phase end to end, and they pair well with the broader website performance optimization techniques you'd apply across a whole site rather than a single page.
Retest after each change, in the lab first and in field data after. Changing three things at once and seeing one better score tells you nothing about which spell worked, and you'll need that knowledge when the next page slows down.
Why a Page Looks Ready but Still Feels Slow
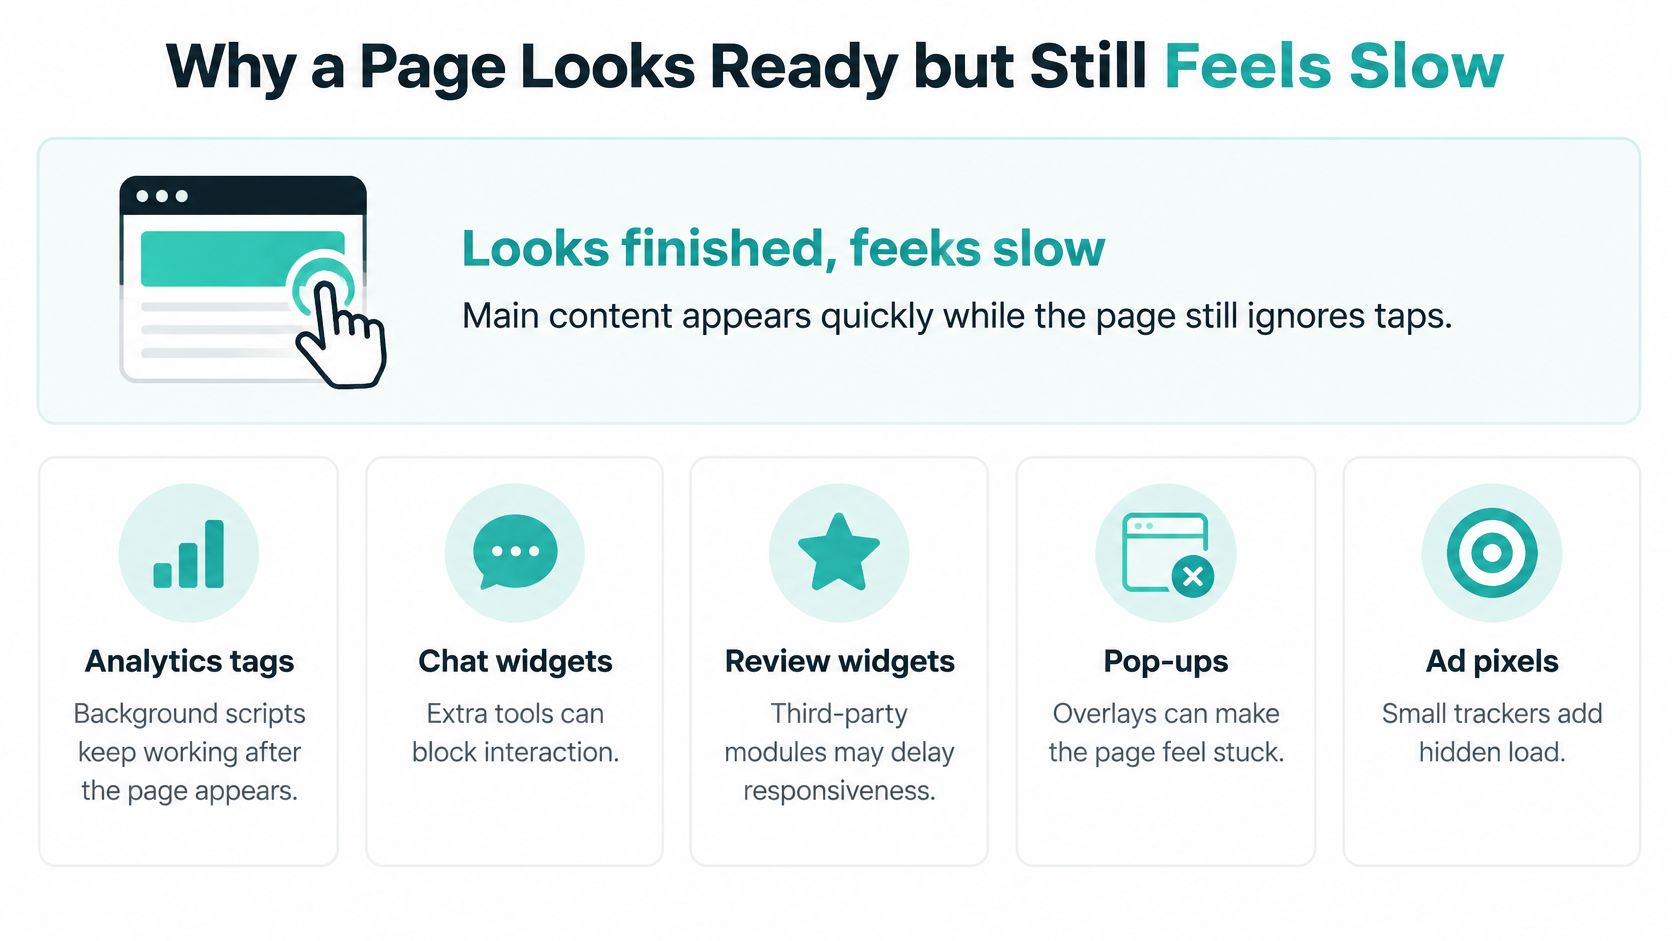
Here's the assumption worth challenging. A page that looks loaded isn't necessarily a page that's usable. Your headline and hero can paint beautifully while the browser is still too busy to answer a tap, like a shop with a gorgeous window display and a door that won't open.
The Google Search Central guide to Core Web Vitals reflects data showing that 77% of mobile sites achieved good INP, while only 48% passed all Core Web Vitals. Responsiveness alone doesn't guarantee a good experience, and a good-looking load doesn't guarantee responsiveness either.
The Usual Suspects After the Paint
- Analytics and ad tags. Each one is small, but a tag manager can summon dozens of scripts before a visitor clicks anything.
- Chat widgets and review carousels. These load their own scripts, styles, and sometimes fonts, all fighting for the main thread.
- Cookie consent banners. Necessary, but heavy implementations can block interaction and shove content when they appear late.
- Checkout and payment scripts. These arrive exactly where a delayed tap costs the most money.
The mechanism is the long task, any block of JavaScript work longer than 50 milliseconds that keeps the main thread busy. While a long task runs, the browser can't respond to input or paint the result. Stack several back to back and the page feels frozen even though it looks complete.
Say a checkout page loads a payment script late. The visitor taps what looks like the pay button, the layout shifts as the script injects a new option, and the tap lands on the wrong element. That visitor doesn't think "poor INP." They think your store is broken, and they leave with their card still in their pocket.
Fixes follow the diagnosis. Defer non-critical scripts so they run after the page renders. Load chat widgets on first interaction or first scroll instead of on arrival. Split large JavaScript bundles so each page runs only the code it needs. Audit your tag manager and remove vendors nobody uses anymore, because dead tags still eat main-thread time.
Test it yourself in one minute. On a throttled phone profile, tap your primary button within the first two seconds and watch whether the page answers immediately. Then scroll and confirm nothing shifts after the first screen settles. Funnel and checkout pages need this test far more than blog posts do, because every step after the landing page is where slow to load web pages reduce conversions that your traffic reports will never explain.
Keep Speed From Drifting After Launch
Say a small business launches a fast, lean page and celebrates. Over the next year it adds a hero video in spring, a review widget in summer, a pop-up for a holiday sale, and two ad pixels for a new campaign. Nobody notices a problem until phone conversions dip, because each addition felt harmless and nobody was watching the total weight. That's performance drift, and it curses more small sites than any single bad launch.
The 2025 Web Almanac performance chapter reported that 48% of mobile websites achieved good Core Web Vitals compared with 56% of desktop websites. Mobile stays harder to keep fast because constrained bandwidth, weaker processors, and more expensive JavaScript execution punish every extra script you add. A faster host alone doesn't close that gap.
The short tour below shows what ongoing, automated attention to a site looks like in practice.
A Monthly Routine Small Enough to Actually Keep
- Set a performance budget before each release. Decide the maximum image weight and script kilobytes your landing pages may carry, and treat anything over budget as a negotiation, not an automatic yes.
- Test funnel steps on a phone after every change. Your homepage can stay fast while checkout rots, so tap through the full path a buyer takes, not just the front door.
- Log your numbers monthly. Record the 75th percentile for LCP, INP, and CLS per page template in a spreadsheet, next to conversion rate, so speed changes and money changes sit in the same view.
- Validate fixes over a full field window. Write down the percentile before a change, wait for the next rolling field-data period, and compare by template and device class before declaring victory.
- Confirm all three metrics pass. One failing metric keeps the page failing, so if a number still misses its threshold, go back to diagnosis instead of adding more fixes at random.

You don't need a performance engineer to run this. You need a calendar reminder, a spreadsheet, and the discipline to check before you ship. This is also where automation earns its keep. On our side, the Speed Sprite familiar compresses images and monitors page speed, and every Web Mage site includes four built-in AI agents called familiars that run automatically every 24 hours, with no manual setup. Whether you use a tool or a checklist, the principle is identical, and it's worth comparing what any website performance optimization tool patrols before you trust it with the night watch.
Speed isn't a launch task. It's a standing patrol, because every new widget is a small dragon that seemed friendly when it moved in.
Do one thing today. Run PageSpeed Insights on your three most important URLs, write down the three percentile numbers for each, and set a reminder to recheck them after your next release. That single habit turns slow to load web pages from a mystery you discover in lost revenue into a number you catch while it's still cheap to fix.
If you'd rather have that patrol run itself, Web Mage builds your site or funnel from a plain-English description and keeps its familiars on watch, with the Speed Sprite compressing images and monitoring page speed every day. Describe the page you want, let the magic assemble it, and spend your time on offers and customers instead of chasing scripts through waterfalls.