
You've rewritten your landing-page headline, changed the button, and watched sign-ups climb. Wonderful. But did your changes help, or did your newsletter send a crowd of eager buyers that morning? Before you hand the new page a wizard's staff and declare it victorious, you need a fair comparison.
A/B testing in marketing helps you separate a useful change from a lucky afternoon. The trick isn't producing a tidy winner badge. It's checking whether the apparent winner deserves your trust.
Table of Contents
- What A/B Testing Means in Plain Terms
- Which Metric to Track for Each Element
- How Much Traffic a Test Really Needs
- Tools and Best Practices for Testing
- How a Test Runs From Hypothesis to Winner
- Why Test Results Lie and How to Catch Them
- When Ad Platforms and Privacy Rules Change the Math
- Launch Your First Test This Week
What A/B Testing Means in Plain Terms
A/B testing compares randomly assigned experiences to estimate how a change affects a chosen outcome. Think of a wizard brewing alternative potions, handing them to randomly selected halves of a tavern, and counting which group finishes its drink.
The wizard must resist serving the sweeter potion only to thirsty dragon riders. Otherwise, the result might reveal who was thirsty, not which recipe worked better. In marketing, A is the control, your existing experience, and B is the challenger, the changed version.
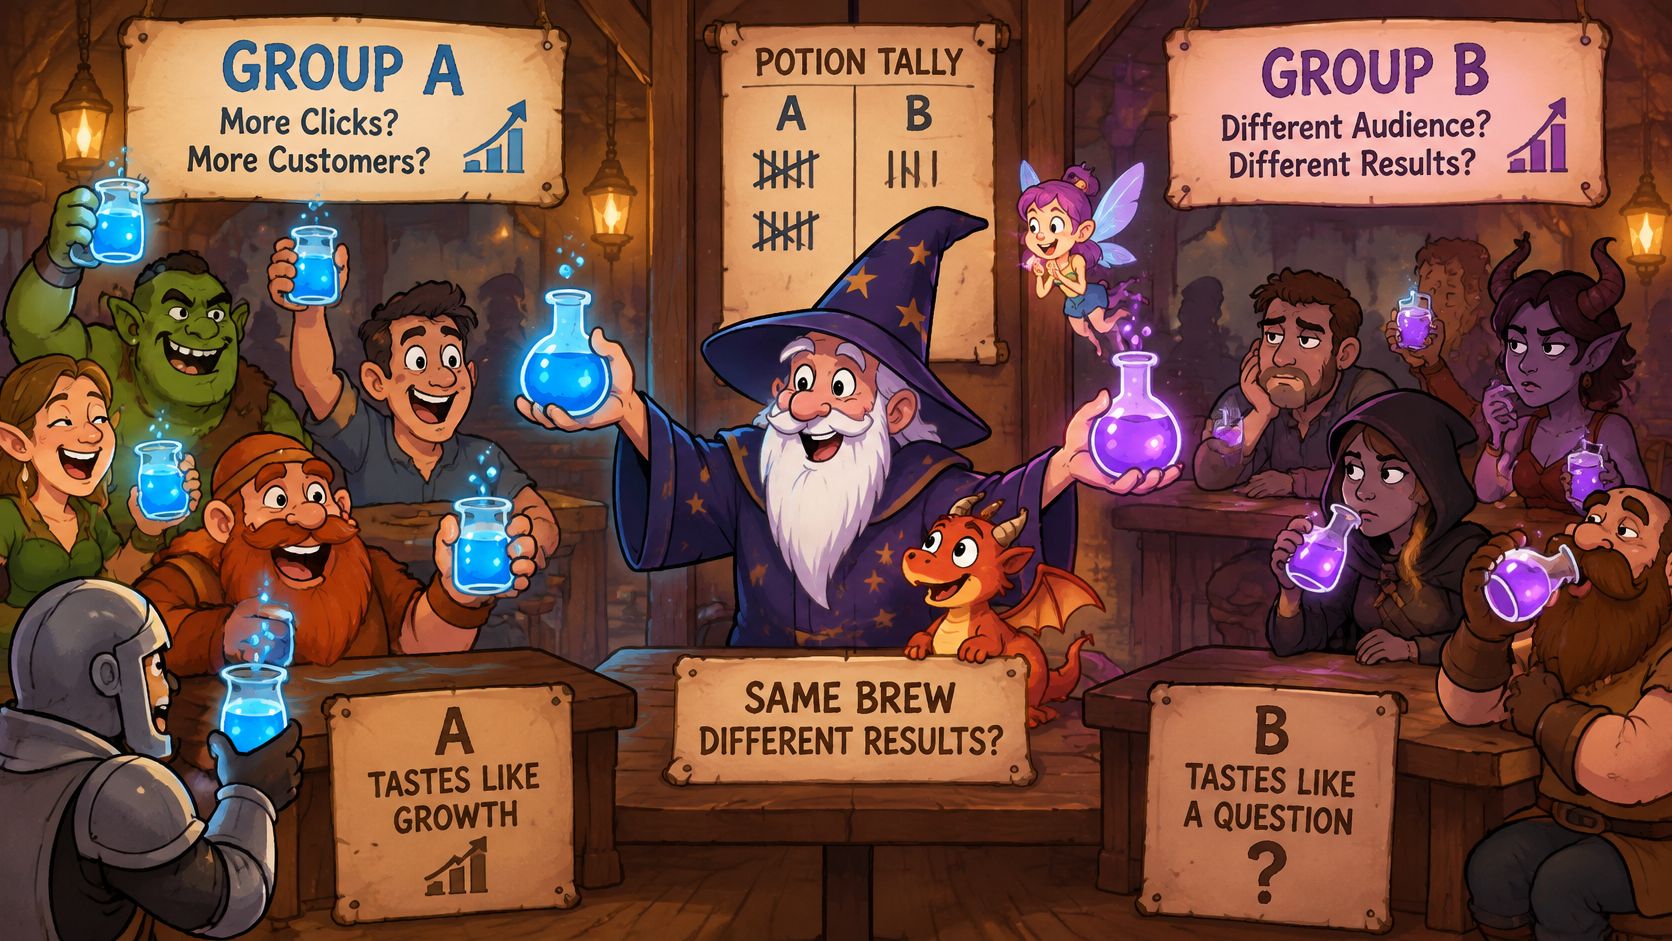
You can test a headline, button colour, price, offer, or landing-page layout. Visitors encounter either the original or the alternative during the same experiment, and you compare their outcomes. Random assignment helps prevent differences in purchase intent, device use, or traffic source from systematically favouring a version.
A fair comparison beats a before-and-after story
Say a bakery replaces a vague catering headline with a clear promise about office delivery. Comparing last weekend's visitors with Monday's newsletter readers wouldn't isolate the headline's effect. Randomly showing both headlines to eligible visitors during the same period creates a more defensible comparison.
As Stanford Graduate School of Business explains, this approach applies the randomized controlled trial, with statistical foundations codified in R. A. Fisher's 1925 Statistical Methods for Research Workers, to digital experimentation that emerged in the late 1990s and early 2000s. The spellbook is older than the software.
Practical rule: A credible test estimates the effect of a change. It doesn't merely celebrate a graph moving upward.
Even a statistically reliable improvement might be too small to justify implementation costs. Conversely, an enormous apparent lift can be uncertain when few people participated.
Write a test idea today: replacing the bakery's vague headline with a delivery-focused headline will increase completed catering enquiries per eligible visitor, the primary metric chosen before launch.
Which Metric to Track for Each Element
Primary and guardrail metrics by tested element
| Element tested | Primary metric | Guardrail metric | Common trap |
|---|---|---|---|
| Headline or hero copy | Sign-up rate | Bounce rate | Novelty spikes in week one |
| Call-to-action button | Click-through to next step | Completed forms | Clicks that never finish |
| Price or offer | Revenue per visitor | Refund and churn rate | Higher price, fewer buyers, same revenue |
| Email subject line | Open rate | Click-to-open rate and unsubscribes | Opens inflated by preview panes |
| Paid ad creative | Cost per qualified lead | Lead-to-sale rate | Platform audience mix differs between variants |
| Checkout flow | Completed purchases | Page load time | Speed regressions hide real wins |
Your primary metric decides the experiment. A guardrail metric catches harm that the headline result might conceal. Choose an outcome close to revenue or your real business objective, rather than whatever produces the most cheerful dashboard.
A headline that earns attention without attracting suitable customers isn't necessarily better. Watch whether early interest persists, and use bounce rate as a warning signal rather than a business outcome in itself.
For a button test, click-through can diagnose whether the next step is clearer. But if visitors click and then abandon the form, you haven't solved the conversion problem.
Follow the customer beyond the first action
A price increase can reduce purchases while leaving revenue per visitor unchanged. Refunds, churn, fulfilment costs, and margin help determine whether the offer is commercially worthwhile.
Email opens are particularly slippery because preview panes and automated loading can register activity without deliberate reading. Treat open rate as a directional signal, confirm engagement through clicks, and remember that click-to-open calculations inherit uncertainty from the open count.
For paid creative, define what makes a lead qualified before you count it. Otherwise, an enticing ad might attract bargain-hunting pixies who never become customers.
Checkout experiments should favour completed purchases, not merely progression through individual screens. Our checkout-page optimization guide offers practical places to look for friction before selecting a challenger.
Choose the metric before seeing the results, or you'll be tempted to crown whichever number happens to sparkle.
Record the guardrail conditions too. If a variant changes loading speed, that's part of the experience you tested, not an irrelevant technical footnote.
How Much Traffic a Test Really Needs
Sizing inputs and what they mean
| Input | What it means | Working example |
|---|---|---|
| Baseline conversion rate | Current rate of the metric | 3% click rate, in Nielsen Norman Group's example |
| Minimum detectable effect | Smallest change worth finding | 20% relative, a 0.6 percentage-point absolute move |
| Significance threshold | Tolerance for false alarms | 95% confidence, the usual threshold identified by Nielsen Norman Group |
| Statistical power | Chance of catching a real effect | 80%, a practical target in GrowthBook's testing guidance |
| Visitors per variant | Sample needed for the target | About 9,600 at a 4% baseline for a 20% lift, using 80% power and 95% confidence, in Knak's worked example |
| Small-gain cost | Traffic for a modest improvement | About 81,000 per variation for a 2.0% to 2.2% shift, in GrowthBook's example |
| Diagnostic floor | Sanity check on conversions | About 100 conversions per variation, a diagnostic rule, not a substitute for GrowthBook's formal power calculation |
The baseline tells your calculator where you're starting. The minimum detectable effect, or MDE, tells it how small an improvement you want a reasonable chance of detecting. Asking a crystal ball to distinguish a faint glimmer requires more evidence than asking it to spot a dragon.
In Nielsen Norman Group's example, the relative change means multiplying the starting click rate by the proposed improvement. The resulting target range is roughly 2.4% to 3.6%. Percentage points describe the absolute gap; relative percentages describe that gap compared with the starting rate.
Why smaller gains need larger crowds
The visitor examples in the table describe different experiments, not successive calculations for the same page. Don't borrow a sample requirement from a site with a different baseline or target effect.
Power describes the chance of detecting the chosen effect if it exists. The significance threshold controls false alarms under the test's assumptions; it doesn't tell you the probability that your challenger is better.
Use a sample-size calculator suited to your metric and save its assumptions. Revenue per visitor needs different statistical treatment from a simple converted-or-not outcome.
Low traffic means prioritizing larger, meaningful behavioural changes and reporting uncertainty clearly. It doesn't mean lowering the drawbridge for flimsy evidence.
Tools and Best Practices for Testing
Client-side editors suit visible landing-page changes such as headlines and buttons. They let marketers alter the browser experience without rebuilding the application, but you should check for flicker, delayed rendering, and tracking discrepancies.
Server-side experiments and feature flags suit checkout logic, pricing, or experiences that must remain consistent across visits. They usually need more engineering involvement, including reliable assignment and exposure logging. An email platform's split-send feature is the more natural choice for subject lines.
Choose auditability over a winner badge
Compare tools by what you can inspect. Our A/B testing tools guide can help you evaluate approaches, but your shortlist should include access to assignment counts, actual exposures, conversion events, and guardrails.
Pair the testing platform with analytics that lets you export underlying counts. A dashboard label isn't a statistical explanation, and an attractive chart won't reveal whether the conversion event fired twice.
For ecommerce teams, Wojo Media's discussion of how to turn paid traffic into profitable sales provides useful commercial context. Use that perspective to select experiments that improve the whole buying journey, rather than isolated interactions.
Apply the same operating checklist regardless of tool:
- Save the calculation. Attach the sizing assumptions and calculator output to the experiment record.
- Predefine stopping. Specify when you'll analyse results and what would justify an emergency pause.
- Keep changes interpretable. Test a single element when you need to identify its contribution.
- Audit operations. Monitor assignment, tracking, and customer harm without using interim results to stop a fixed-horizon test.
- Require review. Have a person assess the evidence before accepting an automated promotion.
Automation can handle repetitive work. It shouldn't replace responsibility for the decision.
How a Test Runs From Hypothesis to Winner
Treat the experiment as a documented decision, not a contest between your favourite designs. This visual summarizes the cycle; the operating steps underneath make it auditable.
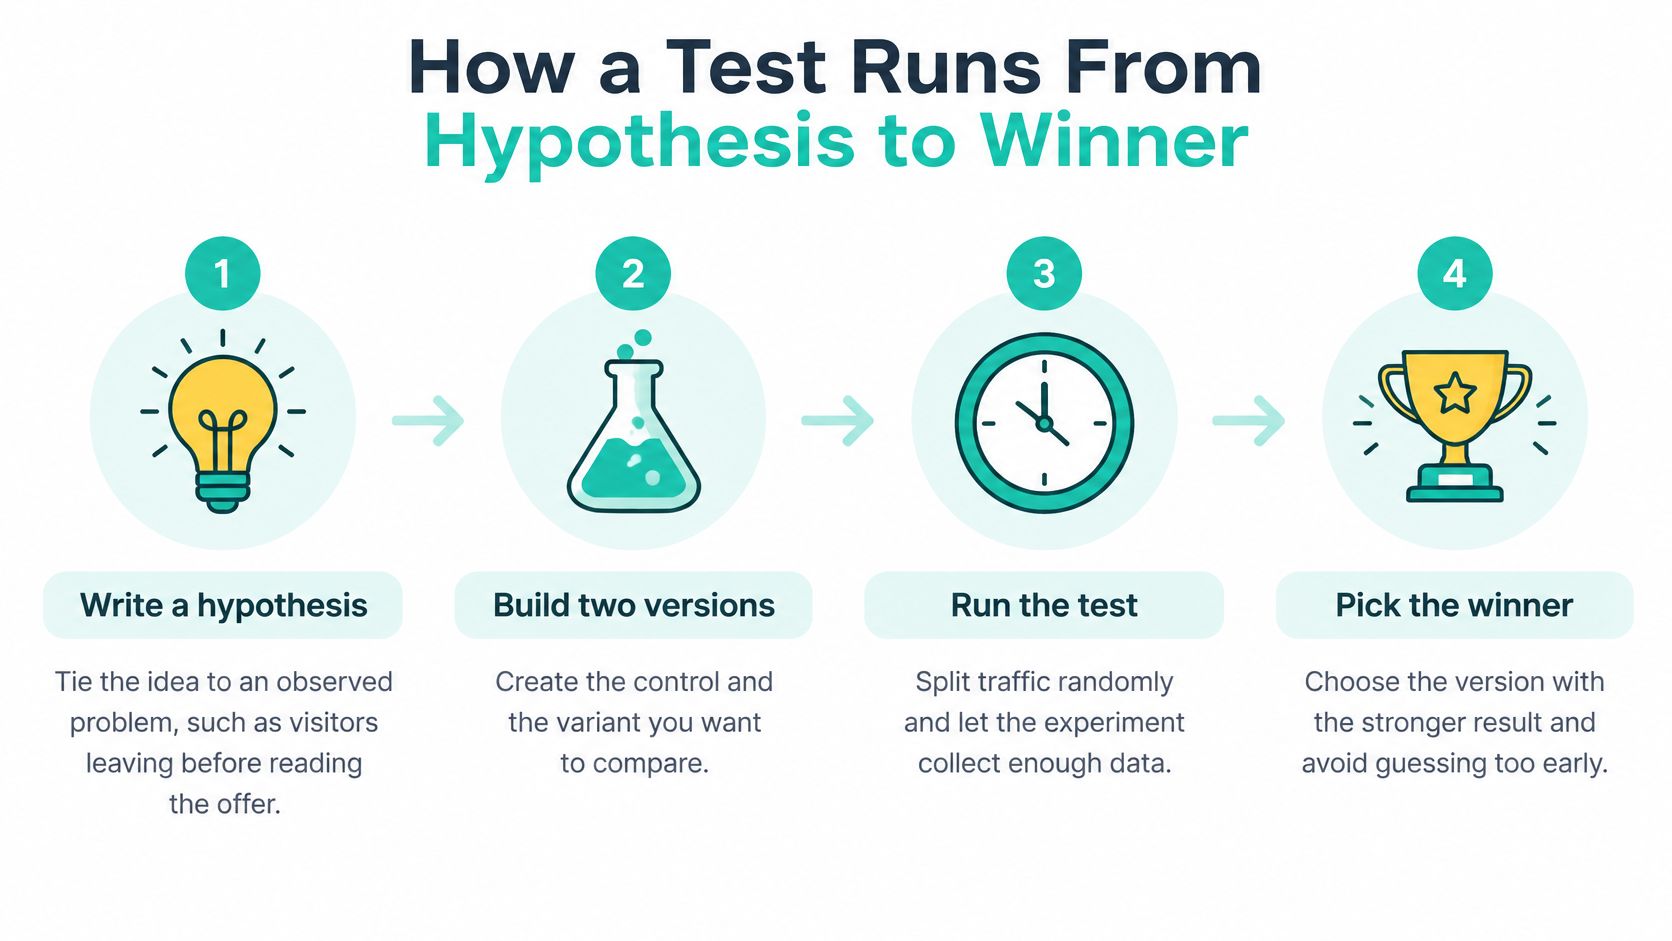
Write a hypothesis tied to an observed problem. If visitor behaviour suggests people leave before understanding the offer, propose a shorter, clearer headline to improve sign-ups. Avoid testing a hunch merely because a senior warlock likes the wording.
Choose the decision metric and guardrails. State exactly which event counts as success and which outcomes must not deteriorate. The common slip is treating a convenient interaction, such as a click, as proof of customer value.
Calculate the experiment's requirements. Enter your baseline, worthwhile effect, significance threshold, and power into the calculator, then translate the sample into an estimated duration. Picking an arbitrary visitor count gives you a schedule without an evidential foundation.
Build and quality-check the challenger. Keep the intended change isolated, then verify forms, mobile layouts, accessibility, and event tracking. Changing the headline, image, and price together tests a package, not the individual ingredients.
Randomize eligible traffic consistently. Use an even split when appropriate, preserving each participant's assigned experience. Don't assign returning visitors exclusively to the control, because visitor familiarity would then differ systematically.
Follow the planned collection rule. Allow representative customer behaviour and the required sample to accumulate. Stopping because the challenger looks ahead early is the experimental equivalent of declaring victory halfway through a dragon race.
Audit validity before interpreting performance. Check assignment against the intended allocation, reconcile exposure logs, and inspect guardrails. An unexplained imbalance needs investigation before any winner announcement.
Make and record the decision. Promote a supported, commercially useful challenger, retain the control when appropriate, or label the result inconclusive. Save losses too, including what they suggest testing next.
Preserve the reasoning, not just the result
Our guide to conversion-rate optimization and UX can help connect observed friction to testable changes. For broader campaign experimentation ideas, the marketing testing insights from AI Optimization Services offer another planning resource.
For a visual companion to the testing workflow, watch the walkthrough below.
A clean finish includes the planned sample, a supported effect estimate with uncertainty, intact guardrails, and a written learning. A stable-looking lead alone isn't enough.
Why Test Results Lie and How to Catch Them
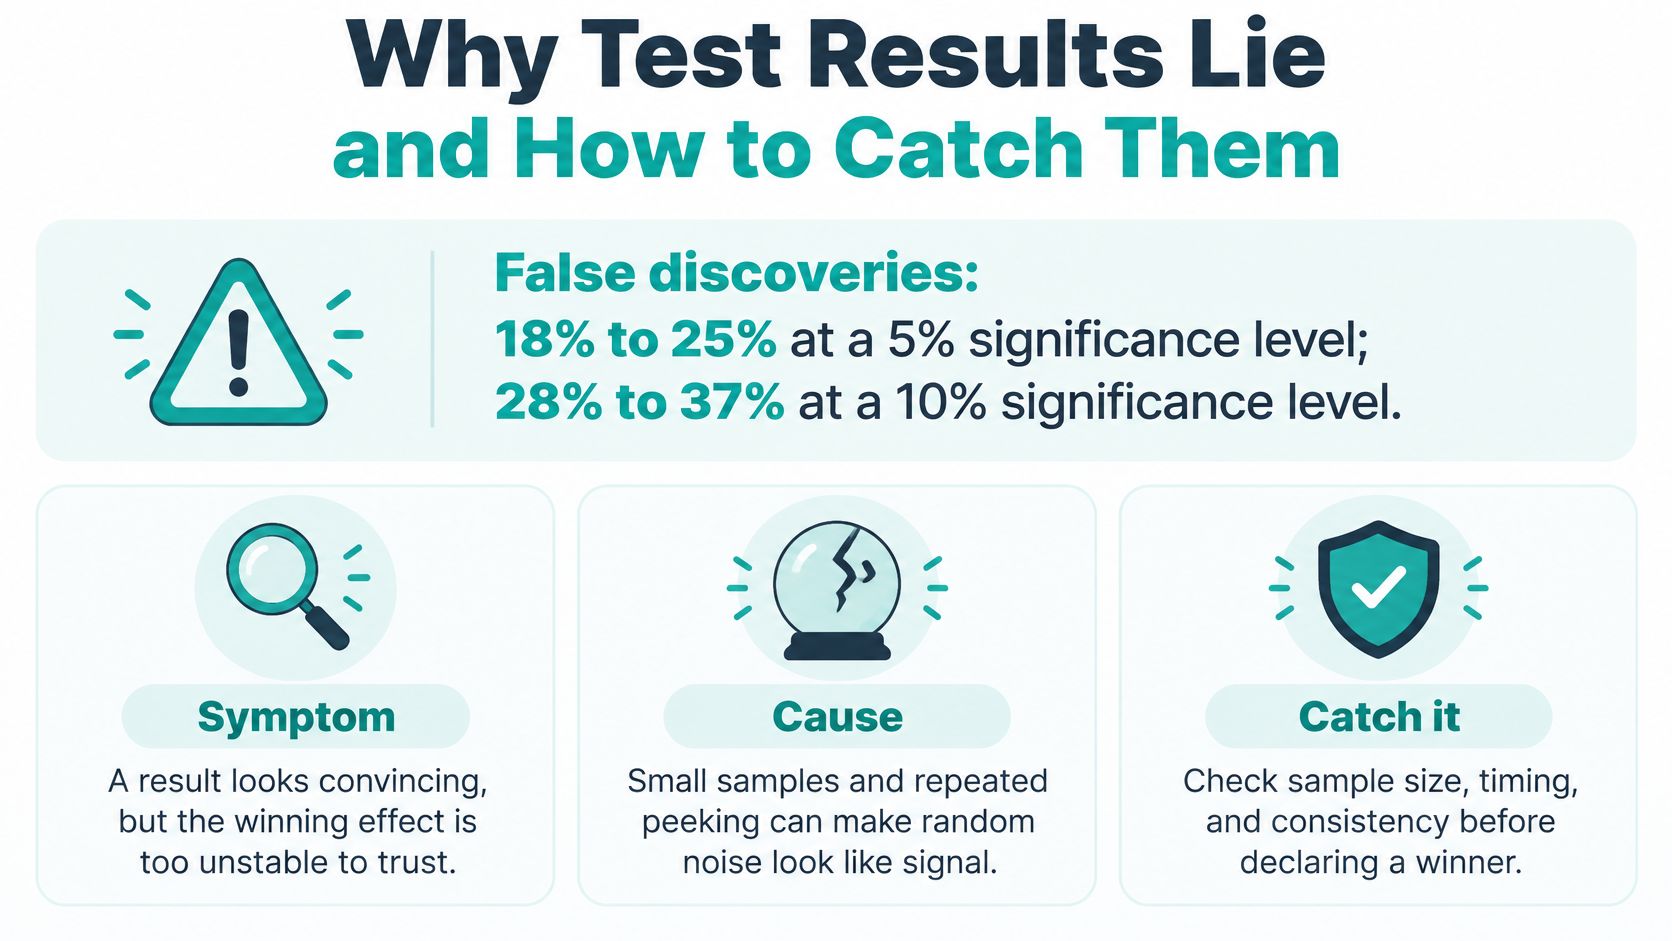
A Management Science study of 4,964 effects from 2,766 commercial website experiments estimated false-discovery rates of 18% to 25% at a two-sided 5% significance level, and 28% to 37% at 10%, as summarized in Wikipedia's A/B testing overview. Those estimates describe that collection of experiments, not a guaranteed error rate for your next test.
The distinction matters: the significance threshold isn't the share of declared winners that must be false. Treat every apparent winner as a claim requiring an audit.
Misleading results, their causes and fixes
| Symptom | Likely cause | Fix |
|---|---|---|
| Winner flips after two days | Peeking and early stopping | Lock sample size and stop rule before launch. New cycle if already stopped selectively |
| Split reads 60/40 instead of 50/50 | Assignment or bot problem | Check logs and filter duplicate and bot visitors. Afternoon triage, then assess whether a rerun is needed |
| Big lift on a tiny sample | Low power and noise | Extend under the original plan, or rerun with more traffic. Test-cycle work |
| Win on clicks, loss in revenue | Wrong primary metric | Judge on revenue or qualified leads. Afternoon diagnosis, usually a redesigned test |
| Variant loads noticeably slower | Speed regression | Compare load times and retest after fixing speed. Afternoon investigation plus new cycle |
| Many tests, one lucky winner | Multiple comparisons | Confirm in a fresh test or holdout. New cycle |
These symptoms are investigation prompts, not automatic verdicts. A small experiment can produce an uneven split by chance; assess whether the mismatch is statistically surprising before blaming bots.
The infographic highlights the central audit question.
Repair the experiment, not the story
Inspect assignment and exposure separately. Someone can be assigned to a variant without successfully seeing it, especially when rendering fails or tracking fires too early.
Filter bots and duplicates using rules established independently of which variant won. Removing inconvenient visitors after seeing the outcome can introduce another bias.
Audit checkpoint: A fresh confirmation is more persuasive than another explanation for why an unstable winner probably counts.
If you repaired a material bug, don't casually combine the broken and repaired periods. Record the incident and decide whether the intended comparison still exists.
When Ad Platforms and Privacy Rules Change the Math
Did the winning ad deliver a better message, or did the platform deliver a better audience? An apparently clean split doesn't necessarily give you an equally clean creative comparison.
A 2025 Journal of Marketing study, summarized by the American Marketing Association, found that proprietary relevance and auction algorithms can expose ad variants to different, unobservable audience mixes. The apparent creative advantage may therefore reflect allocation or auction dynamics rather than the message alone.
Separate the experimental layers
- Creative effectiveness. Randomize messages within a stable audience where the assignment mechanism supports a fair comparison. Record what the platform controls and what remains hidden.
- Post-click experience. Randomize landing pages after visitors arrive. This estimates the page's effect among those arrivals, not whether the advertising created incremental demand.
- Business incrementality. Use a suitable holdout or geographic experiment to compare business outcomes with and without the intervention. Account for spillover and meaningful differences between regions.
Follow immediate conversions with qualified pipeline, refunds, retention, and profit. A campaign that attracts more form submissions but fewer suitable customers hasn't necessarily earned a larger budget.
Privacy limits require honest uncertainty
In Ascend2's 2025 marketer survey, 51% named limited traffic as a testing challenge, while nearly 80% said privacy rules had changed their testing practices. Small businesses can't assume an endless supply of identifiable participants.
Minimize collected data and document eligibility, consent handling, and assignment limitations. Where persistent assignment isn't possible, define the experimental unit carefully rather than pretending every session belongs to a different person.
Test larger behavioural changes when subtle improvements are impractical to establish. Sequential or Bayesian methods can support different decision frameworks, but neither conjures information from absent traffic; specify their stopping criteria and uncertainty reporting before launch.
For automated promotion, require observable assignment, credible allocation, downstream checks, and holdout or follow-up validation. The winning spell should create durable business value, not merely prettier campaign reporting.
Launch Your First Test This Week
Pick a page or email that already receives relevant traffic. Write down the observed customer problem, your proposed change, and the outcome that would justify keeping it before touching the design.
For a course creator, that might mean testing whether a clearer explanation of who the course serves increases suitable enquiries. For a shop, it might mean testing clearer delivery information near the purchase decision. Prefer a change connected to real hesitation over a decorative button-colour duel.
Prepare a launch record you can defend
Create a shared experiment document containing the control, challenger, eligible audience, assignment method, primary metric, guardrails, sizing assumptions, and stopping rule. Add an owner who can pause the test if checkout breaks or tracking fails.
Estimate the decision date from eligible traffic, not total website visits. Leave room for the customer behaviour you need to observe, including delayed purchases or lead qualification. Your calendar appointment is a review point, not permission to manufacture a conclusion if evidence is insufficient.
Expect some ideas to fail. In its 2024 State of Business Experimentation survey of more than 100 global Test & Learn clients, Mastercard reported that nearly half of business experiments failed to break even or validate the initial hypothesis, with the share reaching 46% in retail. Budget for a sequence of manageable experiments rather than staking everything on a grand redesign.
A losing challenger can save you from rolling out an expensive mistake. That's useful knowledge, even without celebratory confetti.
Put automation in its proper role
Our Conversion Alchemist familiar drafts challenger headlines, layouts, or offers, creates and runs A/B split tests, monitors results, and automatically promotes winners while retiring losers. Creating and monitoring a split test costs about 5 credits.
Our $8 monthly plan includes 500 credits every month, unlimited pages and funnels, speed, broken-link and keyword patrols, monthly SEO review, weekly analytics reading, hosting, SSL, and a custom sub-domain. These tools reduce the operational work, but you should still verify the planned sample and guardrails and review promotion decisions.
Launch a test this week with a written hypothesis and a single primary metric. Put the decision review on your calendar using the estimated collection period, and record what you'll do if the result remains uncertain.
Web Mage builds websites and funnels from plain-English prompts, with a Conversion Alchemist to create and run split tests as you improve them. Visit Web Mage to build your page and put a documented experiment behind your next marketing change, keeping the magic in the workflow and the rigour in the decision.